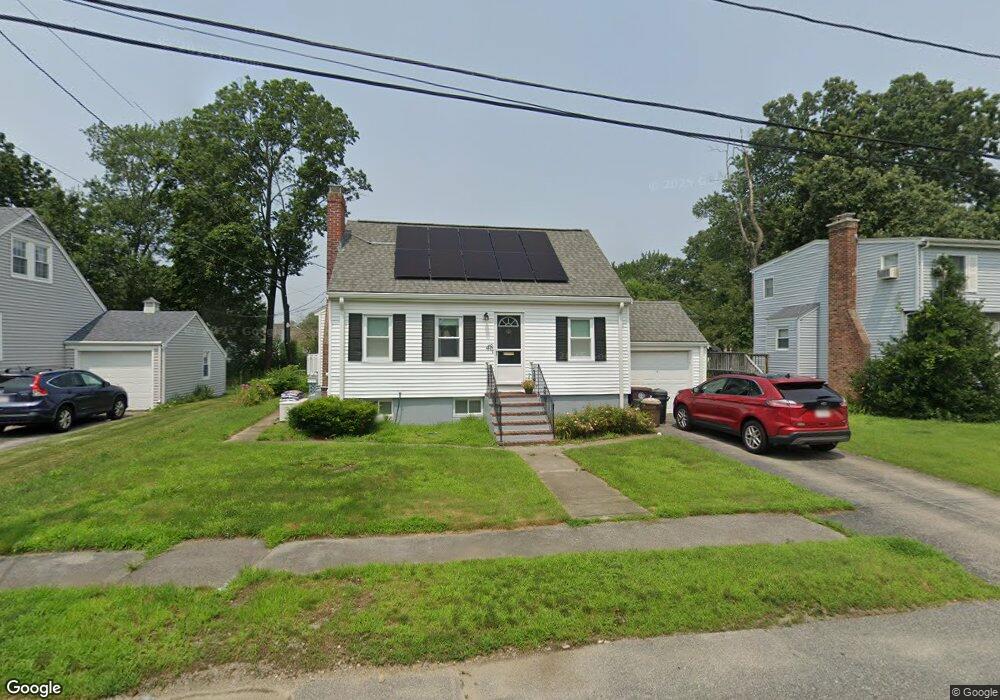
48 Welland Rd Weymouth, MA 02188
Weymouth Landing NeighborhoodEstimated Value: $560,458 - $587,000
3
Beds
1
Bath
1,026
Sq Ft
$559/Sq Ft
Est. Value
About This Home
This home is located at 48 Welland Rd, Weymouth, MA 02188 and is currently estimated at $573,729, approximately $559 per square foot. 48 Welland Rd is a home located in Norfolk County with nearby schools including Frederick C Murphy, Abigail Adams Middle School, and Weymouth Middle School Chapman.
Ownership History
Date
Name
Owned For
Owner Type
Purchase Details
Closed on
Jan 12, 2009
Sold by
Goulart Rudolph and Godinho Ruth L
Bought by
Mcgowan Richard P
Current Estimated Value
Home Financials for this Owner
Home Financials are based on the most recent Mortgage that was taken out on this home.
Original Mortgage
$204,000
Outstanding Balance
$134,418
Interest Rate
5.99%
Mortgage Type
Purchase Money Mortgage
Estimated Equity
$439,311
Create a Home Valuation Report for This Property
The Home Valuation Report is an in-depth analysis detailing your home's value as well as a comparison with similar homes in the area
Home Values in the Area
Average Home Value in this Area
Purchase History
| Date | Buyer | Sale Price | Title Company |
|---|---|---|---|
| Mcgowan Richard P | $255,000 | -- |
Source: Public Records
Mortgage History
| Date | Status | Borrower | Loan Amount |
|---|---|---|---|
| Open | Mcgowan Richard P | $204,000 |
Source: Public Records
Tax History Compared to Growth
Tax History
| Year | Tax Paid | Tax Assessment Tax Assessment Total Assessment is a certain percentage of the fair market value that is determined by local assessors to be the total taxable value of land and additions on the property. | Land | Improvement |
|---|---|---|---|---|
| 2025 | $4,762 | $471,500 | $213,200 | $258,300 |
| 2024 | $4,613 | $449,200 | $203,100 | $246,100 |
| 2023 | $4,347 | $416,000 | $188,100 | $227,900 |
| 2022 | $4,249 | $370,800 | $174,200 | $196,600 |
| 2021 | $3,909 | $333,000 | $174,200 | $158,800 |
| 2020 | $3,682 | $308,900 | $174,200 | $134,700 |
| 2019 | $3,592 | $296,400 | $167,500 | $128,900 |
| 2018 | $3,488 | $279,000 | $159,500 | $119,500 |
| 2017 | $3,404 | $265,700 | $151,900 | $113,800 |
| 2016 | $3,297 | $257,600 | $146,100 | $111,500 |
| 2015 | $3,131 | $242,700 | $139,400 | $103,300 |
| 2014 | $2,974 | $223,600 | $129,700 | $93,900 |
Source: Public Records
Map
Nearby Homes
- 24 Blake Rd
- 33 Congress St
- 76 Kingman St
- 15 Summer St
- 16 Lindbergh Ave
- 23-25 Lindbergh Ave
- 19 Vine St Unit 3
- 19 Vine St Unit 1
- 114 Broad St Unit D
- 114 Broad St Unit C
- 11 Richmond St
- 122 Washington St Unit 22
- 36 Brookside Rd
- 286 Broad St
- 12 Klasson Ln
- 200 Justin Dr Unit 3
- 37 Lantern Ln
- 42 Sundin Rd
- 286 Essex St
- 230 Lisle St