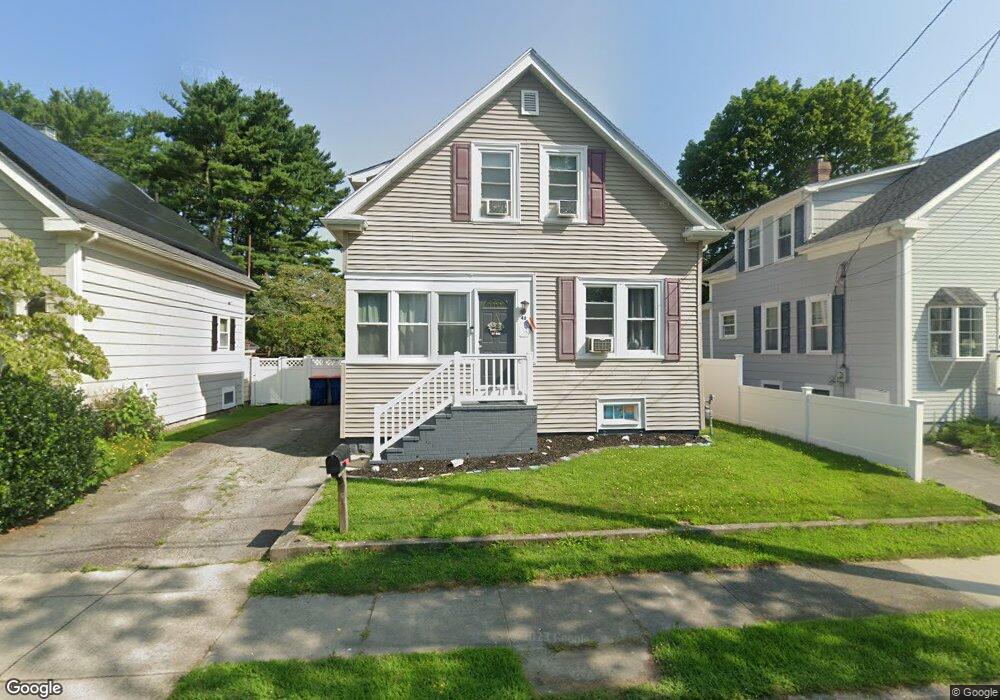
48 Wilding St Fairhaven, MA 02719
North Fairhaven NeighborhoodEstimated Value: $440,000 - $458,000
3
Beds
2
Baths
1,322
Sq Ft
$338/Sq Ft
Est. Value
About This Home
This home is located at 48 Wilding St, Fairhaven, MA 02719 and is currently estimated at $447,097, approximately $338 per square foot. 48 Wilding St is a home located in Bristol County with nearby schools including Fairhaven High School, Alma Del Mar Charter School, and St. Joseph School.
Ownership History
Date
Name
Owned For
Owner Type
Purchase Details
Closed on
Aug 29, 2008
Sold by
Fnma
Bought by
Kersch-Santos Amanda and Santos Linda R
Current Estimated Value
Home Financials for this Owner
Home Financials are based on the most recent Mortgage that was taken out on this home.
Original Mortgage
$162,000
Outstanding Balance
$106,559
Interest Rate
6.29%
Mortgage Type
Purchase Money Mortgage
Estimated Equity
$340,538
Purchase Details
Closed on
Jun 13, 2008
Sold by
Deeringwater Susan E
Bought by
Federal National Mortgage Association
Purchase Details
Closed on
Sep 28, 2001
Sold by
Paradis Mark R and Paradis Cynthia A
Bought by
Deeringwater Susan E
Purchase Details
Closed on
Jan 19, 1990
Sold by
Desrosiers Paul E
Bought by
Paradis Mark R
Create a Home Valuation Report for This Property
The Home Valuation Report is an in-depth analysis detailing your home's value as well as a comparison with similar homes in the area
Home Values in the Area
Average Home Value in this Area
Purchase History
| Date | Buyer | Sale Price | Title Company |
|---|---|---|---|
| Kersch-Santos Amanda | $180,000 | -- | |
| Federal National Mortgage Association | $233,880 | -- | |
| Deeringwater Susan E | $159,900 | -- | |
| Paradis Mark R | $124,000 | -- |
Source: Public Records
Mortgage History
| Date | Status | Borrower | Loan Amount |
|---|---|---|---|
| Open | Paradis Mark R | $162,000 | |
| Previous Owner | Paradis Mark R | $216,000 |
Source: Public Records
Tax History Compared to Growth
Tax History
| Year | Tax Paid | Tax Assessment Tax Assessment Total Assessment is a certain percentage of the fair market value that is determined by local assessors to be the total taxable value of land and additions on the property. | Land | Improvement |
|---|---|---|---|---|
| 2025 | $34 | $361,100 | $172,100 | $189,000 |
| 2024 | $3,242 | $351,200 | $172,100 | $179,100 |
| 2023 | $3,169 | $318,500 | $150,700 | $167,800 |
| 2022 | $3,073 | $300,700 | $140,000 | $160,700 |
| 2021 | $2,940 | $260,400 | $126,700 | $133,700 |
| 2020 | $2,880 | $260,400 | $126,700 | $133,700 |
| 2019 | $2,661 | $228,000 | $105,100 | $122,900 |
| 2018 | $0 | $217,500 | $100,000 | $117,500 |
| 2017 | $2,522 | $209,500 | $100,000 | $109,500 |
| 2016 | $2,436 | $200,000 | $100,000 | $100,000 |
| 2015 | $2,392 | $196,900 | $100,000 | $96,900 |
Source: Public Records
Map
Nearby Homes