48 Woburn St Methuen, MA 01844
The North End NeighborhoodEstimated Value: $581,000 - $724,055
3
Beds
3
Baths
2,160
Sq Ft
$306/Sq Ft
Est. Value
About This Home
This home is located at 48 Woburn St, Methuen, MA 01844 and is currently estimated at $661,514, approximately $306 per square foot. 48 Woburn St is a home located in Essex County with nearby schools including Methuen High School, Community Day Charter Public School - Gateway, and Silver Hill Elementary School.
Ownership History
Date
Name
Owned For
Owner Type
Purchase Details
Closed on
May 6, 2002
Sold by
Jcp T and Franciosa Stephen P
Bought by
Mazza Mark D and Lafrance Cheri
Current Estimated Value
Home Financials for this Owner
Home Financials are based on the most recent Mortgage that was taken out on this home.
Original Mortgage
$260,246
Outstanding Balance
$111,437
Interest Rate
7.13%
Mortgage Type
Purchase Money Mortgage
Estimated Equity
$550,077
Create a Home Valuation Report for This Property
The Home Valuation Report is an in-depth analysis detailing your home's value as well as a comparison with similar homes in the area
Home Values in the Area
Average Home Value in this Area
Purchase History
| Date | Buyer | Sale Price | Title Company |
|---|---|---|---|
| Mazza Mark D | $264,000 | -- |
Source: Public Records
Mortgage History
| Date | Status | Borrower | Loan Amount |
|---|---|---|---|
| Open | Mazza Mark D | $82,000 | |
| Open | Mazza Mark D | $260,246 | |
| Previous Owner | Mazza Mark D | $125,000 |
Source: Public Records
Tax History Compared to Growth
Tax History
| Year | Tax Paid | Tax Assessment Tax Assessment Total Assessment is a certain percentage of the fair market value that is determined by local assessors to be the total taxable value of land and additions on the property. | Land | Improvement |
|---|---|---|---|---|
| 2025 | $6,291 | $594,600 | $185,700 | $408,900 |
| 2024 | $6,382 | $587,700 | $169,600 | $418,100 |
| 2023 | $5,954 | $508,900 | $150,400 | $358,500 |
| 2022 | $5,685 | $435,600 | $125,600 | $310,000 |
| 2021 | $5,277 | $400,100 | $119,300 | $280,800 |
| 2020 | $5,247 | $390,400 | $119,300 | $271,100 |
| 2019 | $4,988 | $351,500 | $113,100 | $238,400 |
| 2018 | $5,013 | $351,300 | $113,100 | $238,200 |
| 2017 | $4,648 | $317,300 | $106,900 | $210,400 |
| 2016 | $4,699 | $317,300 | $106,900 | $210,400 |
| 2015 | $4,516 | $309,300 | $100,700 | $208,600 |
Source: Public Records
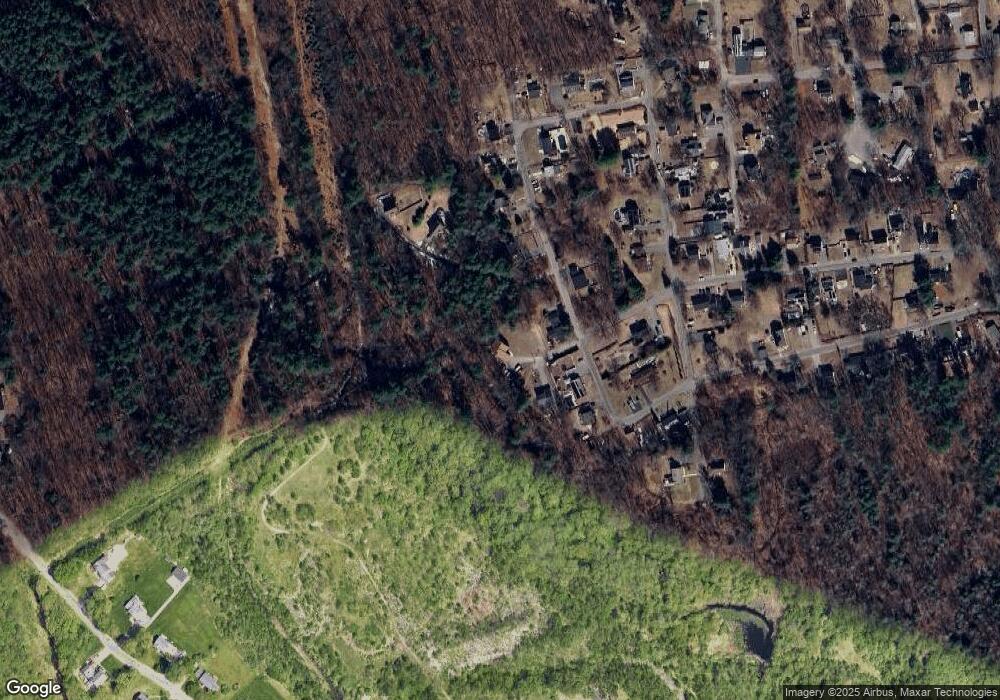
Map
Nearby Homes
- 46 Oneida St
- 7 Sequoia Dr Unit 7
- 18 Maple Ridge Rd
- 95 Pilgrim Cir Unit 95
- 23 Constitution Way Unit 23
- 23 Constitution Way
- 128 Pleasant Valley St
- 122 Pleasant Valley St
- 3 Michael Anthony Rd
- 16 Farley St
- 46 Gaston St
- 10 Albermarle St
- 17 Ferry Rd
- Lot 2 Washington St
- 29 Prescott St
- 25 Thayer St
- 29 Pitman St
- 29 Wallace St
- 45 Christopher Dr Unit 101
- 45 Christopher Dr Unit 314