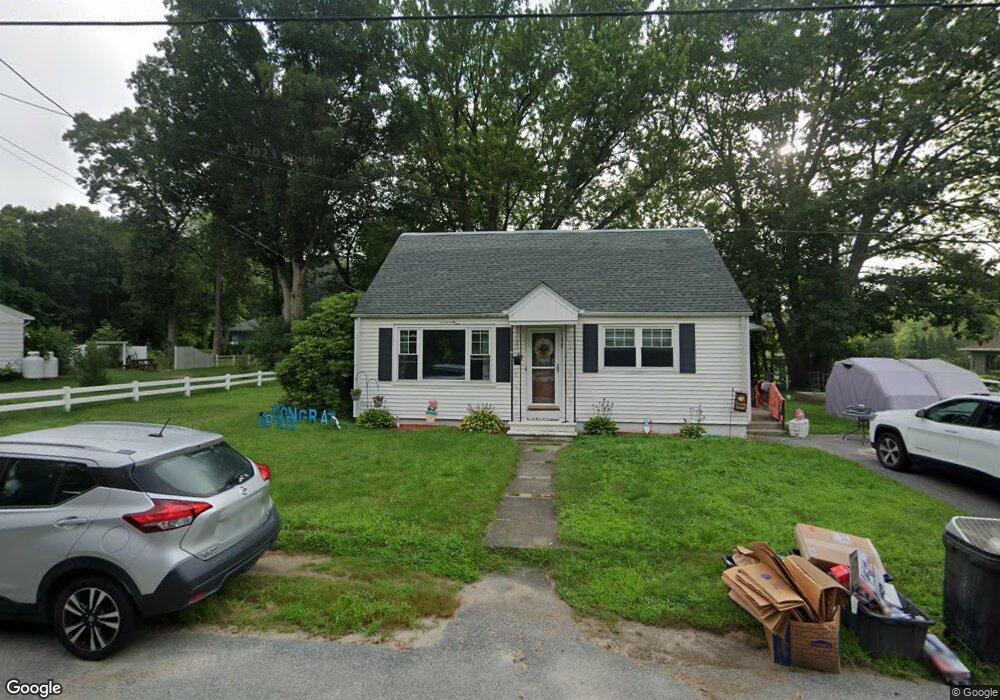
48 Woodland Rd North Smithfield, RI 02896
Estimated Value: $432,000 - $483,000
4
Beds
2
Baths
1,470
Sq Ft
$311/Sq Ft
Est. Value
About This Home
This home is located at 48 Woodland Rd, North Smithfield, RI 02896 and is currently estimated at $456,490, approximately $310 per square foot. 48 Woodland Rd is a home located in Providence County with nearby schools including North Smithfield Elementary School, North Smithfield Middle School, and North Smithfield High School.
Ownership History
Date
Name
Owned For
Owner Type
Purchase Details
Closed on
Aug 6, 2018
Sold by
Wholey Dennis R and Wholey Karen M
Bought by
Wholey Dennis R
Current Estimated Value
Purchase Details
Closed on
Jan 31, 2002
Sold by
Vadeboncoeur Lorraine
Bought by
Wholey Dennis R and Wholey Karen M
Create a Home Valuation Report for This Property
The Home Valuation Report is an in-depth analysis detailing your home's value as well as a comparison with similar homes in the area
Home Values in the Area
Average Home Value in this Area
Purchase History
| Date | Buyer | Sale Price | Title Company |
|---|---|---|---|
| Wholey Dennis R | -- | -- | |
| Wholey Dennis R | $152,000 | -- |
Source: Public Records
Mortgage History
| Date | Status | Borrower | Loan Amount |
|---|---|---|---|
| Previous Owner | Wholey Dennis R | $219,500 | |
| Previous Owner | Wholey Dennis R | $199,500 | |
| Previous Owner | Wholey Dennis R | $194,000 |
Source: Public Records
Tax History Compared to Growth
Tax History
| Year | Tax Paid | Tax Assessment Tax Assessment Total Assessment is a certain percentage of the fair market value that is determined by local assessors to be the total taxable value of land and additions on the property. | Land | Improvement |
|---|---|---|---|---|
| 2024 | $4,316 | $292,200 | $65,800 | $226,400 |
| 2023 | $4,164 | $292,200 | $65,800 | $226,400 |
| 2022 | $4,065 | $292,200 | $65,800 | $226,400 |
| 2021 | $3,673 | $225,500 | $52,400 | $173,100 |
| 2020 | $3,673 | $225,500 | $52,400 | $173,100 |
| 2019 | $3,579 | $225,500 | $52,400 | $173,100 |
| 2018 | $3,188 | $184,900 | $57,500 | $127,400 |
| 2017 | $3,110 | $184,900 | $57,500 | $127,400 |
| 2016 | $3,025 | $184,900 | $57,500 | $127,400 |
| 2015 | $3,134 | $187,900 | $71,100 | $116,800 |
| 2014 | $3,010 | $187,900 | $71,100 | $116,800 |
Source: Public Records
Map
Nearby Homes
- Lot A Old Smithfield Rd
- 111 Sayles Hill Rd
- 253 Central St
- 0 Lot A Old Smithfield Rd N
- 125 Main St
- 252 Railroad St
- 2 Angle St Unit 5
- 13 Plant St
- 19 Marques St
- 274 Albion Rd
- 285 School St
- 5 Edgewood Ave
- 0 Acorn St
- 25 Manville Hill Rd
- 49 Branch Ave
- 256 School St
- 196 Old River Rd Unit 137
- 360 Gauthier Dr
- 378 Gauthier Dr
- 36 Old Louisquisset Pike Unit 104
- 40 Woodland Rd
- 57 Woodland Rd
- 61 Woodland Rd
- 37 Woodland Rd
- 28 Woodland Rd
- 70 Woodland Rd
- 29 Woodland Rd
- 80 Woodland Rd
- 1110 Eddie Dowling Hwy
- 1090 Eddie Dowling Hwy
- 17 Woodland Rd
- 9 Sayles Hill Rd
- 15 Sayles Hill Rd
- 1124 Eddie Dowling Hwy
- 1066 Eddie Dowling Hwy
- 7 Sayles Hill Rd
- 1130 Eddie Dowling Hwy
- 1130 Eddie Dowling Hwy
- 1130 Eddie Dowling Hwy
- 1099 Eddie Dowling Hwy