Estimated Value: $242,000 - $322,000
1
Bed
1
Bath
702
Sq Ft
$398/Sq Ft
Est. Value
About This Home
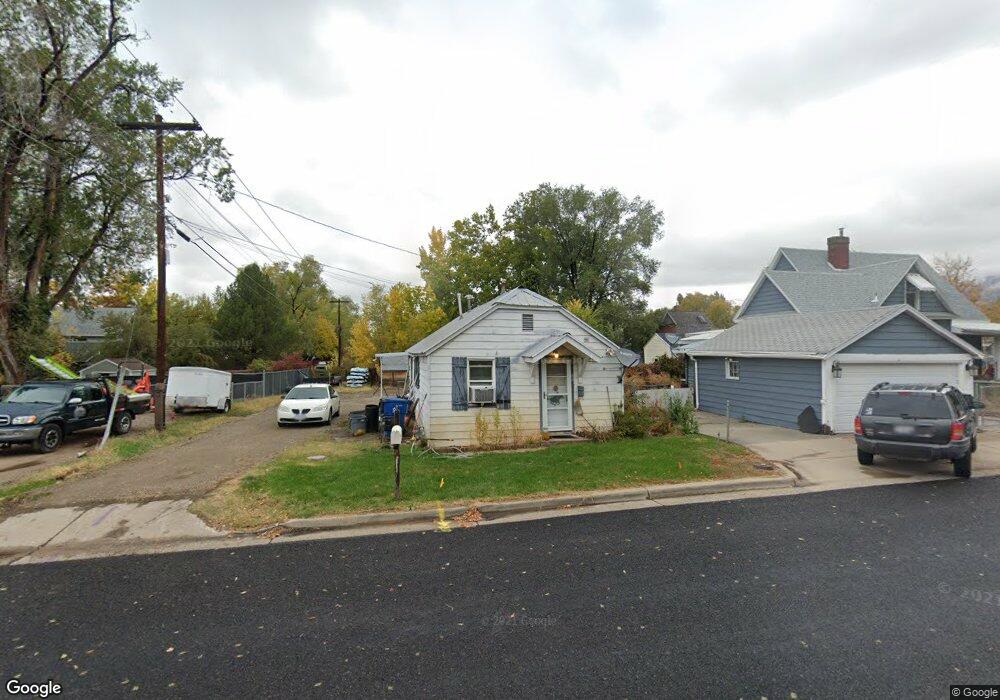
This home is located at 480 37th St, Ogden, UT 84403 and is currently estimated at $279,136, approximately $397 per square foot. 480 37th St is a home located in Weber County with nearby schools including Burch Creek School, South Ogden Junior High School, and Bonneville High School.
Ownership History
Date
Name
Owned For
Owner Type
Purchase Details
Closed on
Nov 22, 2019
Sold by
Buchanan Thomas G
Bought by
Buchanan Michelle Louise and Nickel Trust
Current Estimated Value
Purchase Details
Closed on
Apr 25, 2012
Sold by
Johnson Elsie Jayne and Roundy Lorraine
Bought by
Buchanan Thomas G
Home Financials for this Owner
Home Financials are based on the most recent Mortgage that was taken out on this home.
Original Mortgage
$3,216
Outstanding Balance
$2,228
Interest Rate
3.9%
Mortgage Type
FHA
Estimated Equity
$276,908
Create a Home Valuation Report for This Property
The Home Valuation Report is an in-depth analysis detailing your home's value as well as a comparison with similar homes in the area
Home Values in the Area
Average Home Value in this Area
Purchase History
| Date | Buyer | Sale Price | Title Company |
|---|---|---|---|
| Buchanan Michelle Louise | -- | None Available | |
| Buchanan Thomas G | -- | First American Title Company |
Source: Public Records
Mortgage History
| Date | Status | Borrower | Loan Amount |
|---|---|---|---|
| Open | Buchanan Thomas G | $3,216 |
Source: Public Records
Tax History
| Year | Tax Paid | Tax Assessment Tax Assessment Total Assessment is a certain percentage of the fair market value that is determined by local assessors to be the total taxable value of land and additions on the property. | Land | Improvement |
|---|---|---|---|---|
| 2025 | $1,866 | $133,516 | $49,605 | $83,911 |
| 2024 | $1,736 | $127,598 | $49,400 | $78,198 |
| 2023 | $1,530 | $111,100 | $52,537 | $58,563 |
| 2022 | $1,567 | $119,351 | $41,805 | $77,546 |
| 2021 | $1,248 | $154,000 | $42,701 | $111,299 |
| 2020 | $1,179 | $135,001 | $33,764 | $101,237 |
| 2019 | $1,134 | $123,000 | $26,134 | $96,866 |
| 2018 | $984 | $98,000 | $26,134 | $71,866 |
| 2017 | $924 | $87,000 | $24,315 | $62,685 |
| 2016 | $882 | $46,061 | $14,431 | $31,630 |
| 2015 | $791 | $38,991 | $14,431 | $24,560 |
| 2014 | $674 | $31,192 | $14,431 | $16,761 |
Source: Public Records
Map
Nearby Homes
Your Personal Tour Guide
Ask me questions while you tour the home.