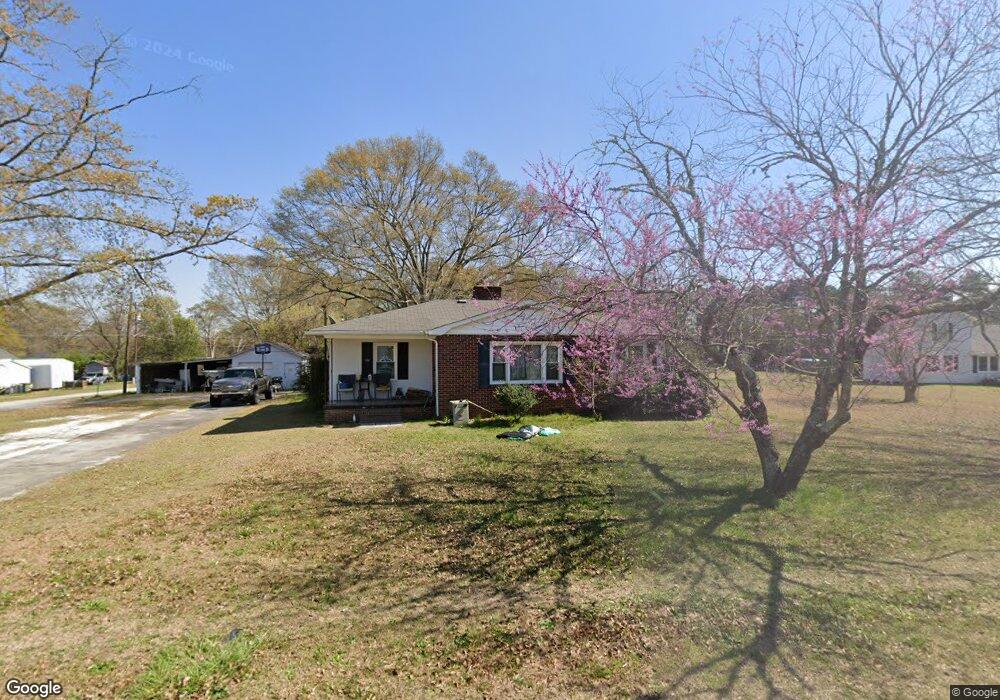
480 Cleveland St Pacolet, SC 29372
Estimated Value: $98,000 - $185,000
3
Beds
1
Bath
1,232
Sq Ft
$108/Sq Ft
Est. Value
About This Home
This home is located at 480 Cleveland St, Pacolet, SC 29372 and is currently estimated at $133,095, approximately $108 per square foot. 480 Cleveland St is a home located in Spartanburg County with nearby schools including Broome High School.
Ownership History
Date
Name
Owned For
Owner Type
Purchase Details
Closed on
Apr 5, 2019
Sold by
Willingham Ralph Timothy
Bought by
Greer Brandy M
Current Estimated Value
Purchase Details
Closed on
Feb 3, 2009
Sold by
Secretary Of Housing & Urban Development
Bought by
Willingham Ralph Timothy
Home Financials for this Owner
Home Financials are based on the most recent Mortgage that was taken out on this home.
Original Mortgage
$31,019
Interest Rate
5.23%
Mortgage Type
Purchase Money Mortgage
Purchase Details
Closed on
Jul 21, 2008
Sold by
Farwell Tonya L
Bought by
Hud
Purchase Details
Closed on
Oct 31, 2006
Sold by
Carrigan Charlene P
Bought by
Farwell Tonya L
Home Financials for this Owner
Home Financials are based on the most recent Mortgage that was taken out on this home.
Original Mortgage
$81,257
Interest Rate
6.25%
Mortgage Type
New Conventional
Create a Home Valuation Report for This Property
The Home Valuation Report is an in-depth analysis detailing your home's value as well as a comparison with similar homes in the area
Home Values in the Area
Average Home Value in this Area
Purchase History
| Date | Buyer | Sale Price | Title Company |
|---|---|---|---|
| Greer Brandy M | $10,000 | None Available | |
| Willingham Ralph Timothy | $32,652 | -- | |
| Hud | $91,504 | -- | |
| Farwell Tonya L | $81,900 | None Available |
Source: Public Records
Mortgage History
| Date | Status | Borrower | Loan Amount |
|---|---|---|---|
| Previous Owner | Willingham Ralph Timothy | $31,019 | |
| Previous Owner | Farwell Tonya L | $81,257 |
Source: Public Records
Tax History Compared to Growth
Tax History
| Year | Tax Paid | Tax Assessment Tax Assessment Total Assessment is a certain percentage of the fair market value that is determined by local assessors to be the total taxable value of land and additions on the property. | Land | Improvement |
|---|---|---|---|---|
| 2025 | $737 | $2,511 | $477 | $2,034 |
| 2024 | $737 | $2,511 | $477 | $2,034 |
| 2023 | $737 | $2,511 | $477 | $2,034 |
| 2022 | $658 | $2,184 | $488 | $1,696 |
| 2021 | $658 | $2,184 | $488 | $1,696 |
| 2020 | $646 | $2,184 | $488 | $1,696 |
| 2019 | $687 | $3,160 | $706 | $2,454 |
| 2018 | $1,696 | $3,160 | $706 | $2,454 |
| 2017 | $1,501 | $2,748 | $606 | $2,142 |
| 2016 | $1,478 | $2,748 | $606 | $2,142 |
| 2015 | $1,466 | $2,748 | $606 | $2,142 |
| 2014 | $1,461 | $2,748 | $606 | $2,142 |
Source: Public Records
Map
Nearby Homes
- 591 Dogwood Cir
- 121 State Road S-42-2485
- 508 Jerusalem Rd
- 1050 S Carolina 150
- 491 Spruce St
- 411 Hillbrook Cir
- 130 Poplar St
- 20 Pecan St
- 00 State Road S-42-366
- 00 Zion Church Rd
- 26 Pecan St
- 540 W Main St
- 103 Stonecrest Ct
- 117 Sycamore St
- 171 Fernbrook Cir
- 245 Kelli Ct
- 108 Rockport Way
- 1191 N Highway 150
- 244 Kailin Shea Ave
- 121 Anderson Ave