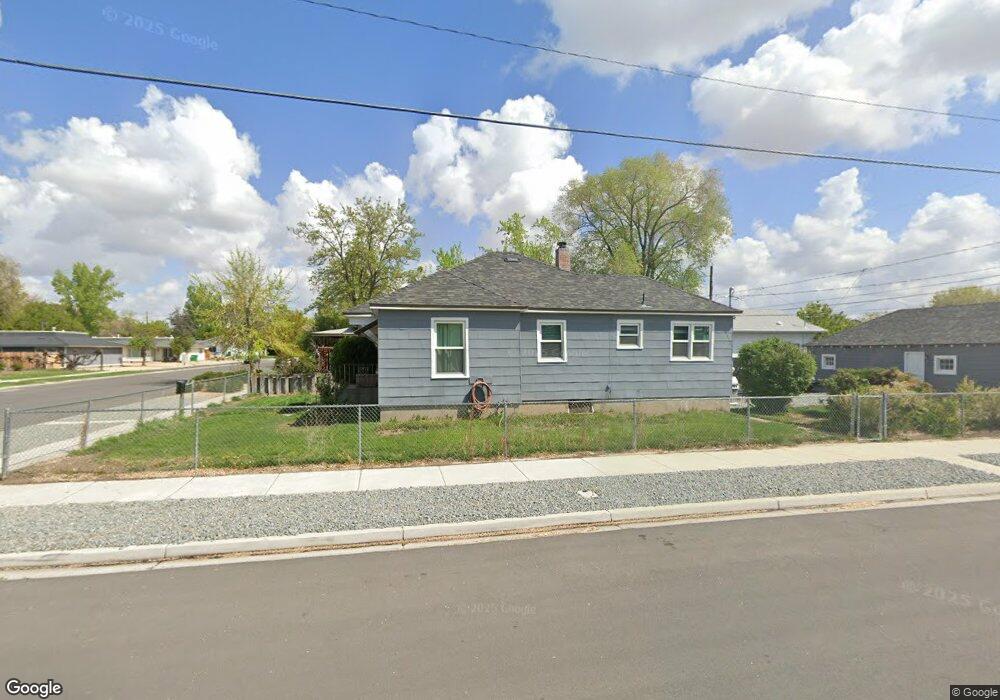
480 E Mclean Way Sparks, NV 89431
McCarran Boulevard-Probasco NeighborhoodEstimated Value: $248,000 - $412,000
3
Beds
2
Baths
1,131
Sq Ft
$319/Sq Ft
Est. Value
About This Home
This home is located at 480 E Mclean Way, Sparks, NV 89431 and is currently estimated at $361,121, approximately $319 per square foot. 480 E Mclean Way is a home located in Washoe County with nearby schools including Greenbrae Elementary School, George L Dilworth Middle School, and Sparks High School.
Ownership History
Date
Name
Owned For
Owner Type
Purchase Details
Closed on
Sep 24, 2025
Sold by
Numan Randall H
Bought by
Fika Properties Llc
Current Estimated Value
Home Financials for this Owner
Home Financials are based on the most recent Mortgage that was taken out on this home.
Original Mortgage
$335,000
Outstanding Balance
$334,402
Interest Rate
6.58%
Mortgage Type
New Conventional
Estimated Equity
$26,719
Purchase Details
Closed on
Sep 26, 2016
Sold by
Numan Randall H and Numan Joyce M
Bought by
Numan Randall M
Home Financials for this Owner
Home Financials are based on the most recent Mortgage that was taken out on this home.
Original Mortgage
$137,000
Interest Rate
3.43%
Mortgage Type
New Conventional
Purchase Details
Closed on
Mar 29, 2000
Sold by
Mcdonnell Patrick Quinn and Mcdonnell Lillian Nevada
Bought by
Numan Randall H and Numan Joyce M
Home Financials for this Owner
Home Financials are based on the most recent Mortgage that was taken out on this home.
Original Mortgage
$40,000
Interest Rate
8.38%
Create a Home Valuation Report for This Property
The Home Valuation Report is an in-depth analysis detailing your home's value as well as a comparison with similar homes in the area
Home Values in the Area
Average Home Value in this Area
Purchase History
| Date | Buyer | Sale Price | Title Company |
|---|---|---|---|
| Fika Properties Llc | $220,000 | Ticor Title | |
| Numan Randall M | -- | First American Title Ins | |
| Numan Randall H | $121,000 | First Centennial Title Co |
Source: Public Records
Mortgage History
| Date | Status | Borrower | Loan Amount |
|---|---|---|---|
| Open | Fika Properties Llc | $335,000 | |
| Previous Owner | Numan Randall M | $137,000 | |
| Previous Owner | Numan Randall H | $40,000 |
Source: Public Records
Tax History Compared to Growth
Tax History
| Year | Tax Paid | Tax Assessment Tax Assessment Total Assessment is a certain percentage of the fair market value that is determined by local assessors to be the total taxable value of land and additions on the property. | Land | Improvement |
|---|---|---|---|---|
| 2026 | $541 | $51,936 | $34,090 | $17,846 |
| 2025 | $707 | $51,277 | $33,565 | $17,712 |
| 2024 | $707 | $47,538 | $30,065 | $17,473 |
| 2023 | $495 | $47,504 | $31,325 | $16,179 |
| 2022 | $667 | $39,332 | $26,180 | $13,152 |
| 2021 | $1,408 | $30,803 | $17,955 | $12,848 |
| 2020 | $1,255 | $29,548 | $16,940 | $12,608 |
| 2019 | $1,378 | $27,824 | $15,890 | $11,934 |
| 2018 | $1,849 | $23,166 | $11,725 | $11,441 |
| 2017 | $574 | $21,635 | $10,395 | $11,240 |
| 2016 | $559 | $20,573 | $9,345 | $11,228 |
| 2015 | $558 | $18,731 | $7,700 | $11,031 |
| 2014 | $542 | $16,884 | $6,440 | $10,444 |
| 2013 | -- | $14,449 | $4,270 | $10,179 |
Source: Public Records
Map
Nearby Homes
- 370 O'Brien Way
- 828 Woodglen Dr Unit 2
- 801 Woodglen Dr Unit 2
- 949 Crestwood Dr Unit 3
- 8 E O St
- 1029 Brooktree Dr Unit 1
- 109 M St
- 684 Oakwood Dr Unit 3
- 87 Gurr Ct
- 97 Prater Way
- 360 E Lincoln Way
- 115 P St
- 181 Quail St
- 1973 Rio Tinto Dr
- 644 Oakwood Dr Unit 2
- 611 Oakwood Dr Unit 1
- 601 Oakwood Dr Unit 4
- 604 Oakwood Dr Unit 1
- 2021 1st St
- 445 Pine Meadows Dr Unit E25
- 1385 Teakwood Dr
- 420 E Mclean Way
- 1380 Dogwood Dr
- 455 E Mclean Way
- 485 E Mclean Way
- 520 E Mclean Way
- 1420 Dogwood Dr
- 1380 Teakwood Dr
- 435 E Mclean Way
- 525 E Mclean Way
- 1465 Teakwood Dr
- 1420 Teakwood Dr
- 425 E Mclean Way
- 1460 Dogwood Dr
- 555 E Mclean Way
- 1325 Dogwood Dr
- 450 O Brien Way
- 1460 Teakwood Dr
- 480 O Brien Way
- 420 O Brien Way