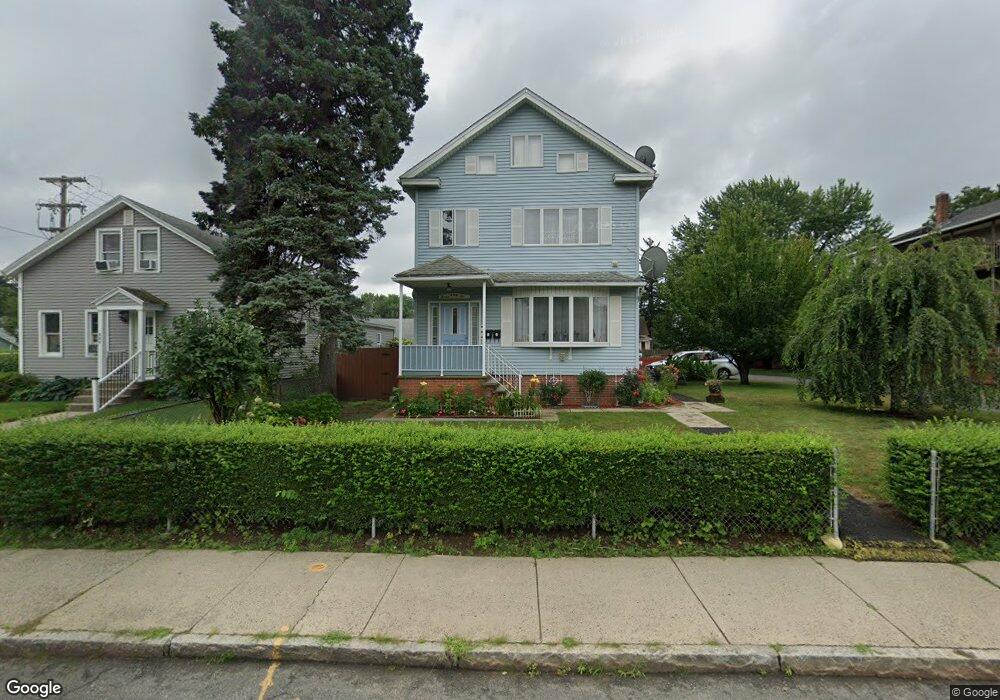
480 Front St Chicopee, MA 01013
Chicopee Center NeighborhoodEstimated Value: $394,000 - $498,000
7
Beds
3
Baths
2,995
Sq Ft
$152/Sq Ft
Est. Value
About This Home
This home is located at 480 Front St, Chicopee, MA 01013 and is currently estimated at $455,333, approximately $152 per square foot. 480 Front St is a home located in Hampden County with nearby schools including Bowe Elementary School, Fairview Middle School, and Chicopee High School.
Ownership History
Date
Name
Owned For
Owner Type
Purchase Details
Closed on
Nov 6, 2020
Sold by
Ksiazek Krystyna
Bought by
Pilat Wladyslaw and Pilat Hieronim
Current Estimated Value
Purchase Details
Closed on
Nov 21, 1983
Bought by
Pilat Wladyslaw and Pilat Hieronim
Create a Home Valuation Report for This Property
The Home Valuation Report is an in-depth analysis detailing your home's value as well as a comparison with similar homes in the area
Home Values in the Area
Average Home Value in this Area
Purchase History
| Date | Buyer | Sale Price | Title Company |
|---|---|---|---|
| Pilat Wladyslaw | -- | None Available | |
| Ksiazek Krystyna | -- | None Available | |
| Pilat Wladyslaw | -- | -- |
Source: Public Records
Mortgage History
| Date | Status | Borrower | Loan Amount |
|---|---|---|---|
| Previous Owner | Pilat Wladyslaw | $10,000 | |
| Previous Owner | Pilat Wladyslaw | $15,000 |
Source: Public Records
Tax History
| Year | Tax Paid | Tax Assessment Tax Assessment Total Assessment is a certain percentage of the fair market value that is determined by local assessors to be the total taxable value of land and additions on the property. | Land | Improvement |
|---|---|---|---|---|
| 2025 | $5,370 | $354,200 | $74,600 | $279,600 |
| 2024 | $5,007 | $339,200 | $73,200 | $266,000 |
| 2023 | $4,683 | $309,100 | $66,500 | $242,600 |
| 2022 | $4,706 | $277,000 | $57,800 | $219,200 |
| 2021 | $3,706 | $256,300 | $52,600 | $203,700 |
| 2020 | $4,271 | $244,600 | $52,600 | $192,000 |
| 2019 | $3,253 | $237,100 | $52,600 | $184,500 |
| 2018 | $4,187 | $228,700 | $50,100 | $178,600 |
| 2017 | $2,993 | $237,500 | $54,000 | $183,500 |
| 2016 | $4,097 | $242,300 | $54,000 | $188,300 |
| 2015 | $3,711 | $211,600 | $54,000 | $157,600 |
| 2014 | $1,856 | $211,600 | $54,000 | $157,600 |
Source: Public Records
Map
Nearby Homes
Your Personal Tour Guide
Ask me questions while you tour the home.