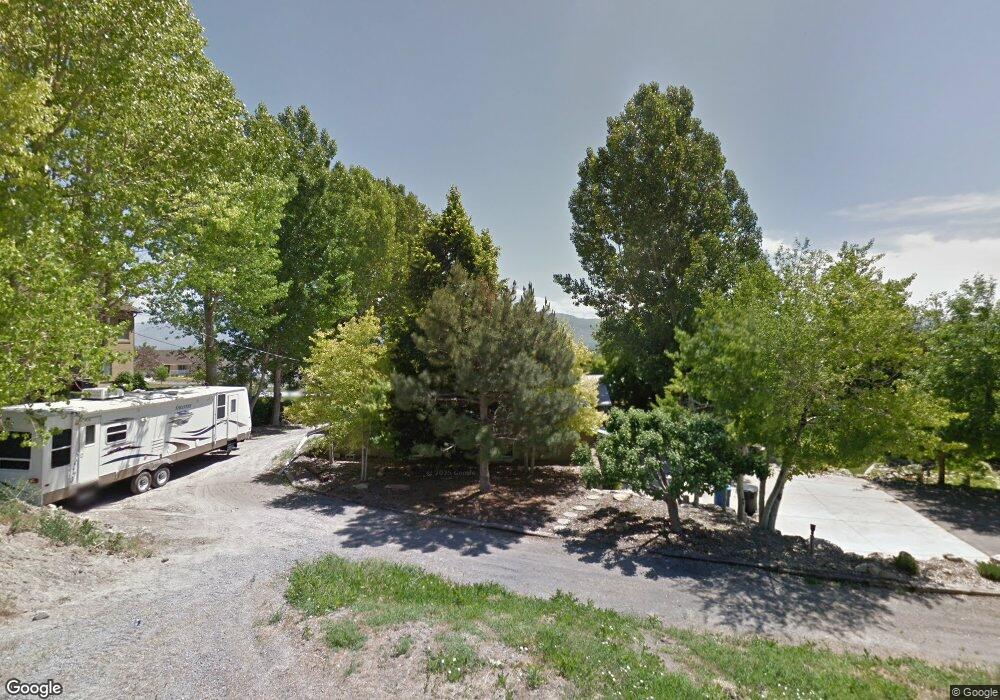
480 N Main St Mendon, UT 84325
Estimated Value: $744,916 - $1,012,000
Studio
--
Bath
3,609
Sq Ft
$240/Sq Ft
Est. Value
About This Home
This home is located at 480 N Main St, Mendon, UT 84325 and is currently estimated at $867,729, approximately $240 per square foot. 480 N Main St is a home with nearby schools including Mountainside School, South Cache Middle School, and Mountain Crest High School.
Ownership History
Date
Name
Owned For
Owner Type
Purchase Details
Closed on
May 21, 2015
Sold by
Ashliman Annette
Bought by
Andersen Randy G and Andersen Tami E
Current Estimated Value
Purchase Details
Closed on
May 5, 2011
Sold by
Ashliman Annette
Bought by
Ashliman Annette
Create a Home Valuation Report for This Property
The Home Valuation Report is an in-depth analysis detailing your home's value as well as a comparison with similar homes in the area
Purchase History
| Date | Buyer | Sale Price | Title Company |
|---|---|---|---|
| Andersen Randy G | -- | Northern Title Company | |
| Ashliman Annette | -- | None Available |
Source: Public Records
Tax History
| Year | Tax Paid | Tax Assessment Tax Assessment Total Assessment is a certain percentage of the fair market value that is determined by local assessors to be the total taxable value of land and additions on the property. | Land | Improvement |
|---|---|---|---|---|
| 2025 | $320 | $423,565 | $0 | $0 |
| 2024 | $340 | $421,280 | $0 | $0 |
| 2023 | $3,364 | $396,315 | $0 | $0 |
| 2022 | $3,682 | $430,795 | $0 | $0 |
| 2021 | $3,266 | $573,275 | $70,560 | $502,715 |
| 2020 | $2,729 | $443,097 | $70,560 | $372,537 |
| 2019 | $2,877 | $443,096 | $70,560 | $372,536 |
| 2018 | $2,572 | $394,570 | $70,560 | $324,010 |
| 2017 | $2,498 | $201,315 | $0 | $0 |
| 2016 | $2,470 | $194,170 | $0 | $0 |
| 2015 | $2,197 | $177,800 | $0 | $0 |
| 2014 | $2,146 | $177,800 | $0 | $0 |
| 2013 | -- | $177,800 | $0 | $0 |
Source: Public Records
Map
Nearby Homes
- 54 W 200 N
- 2500 S 6400 W
- 6770 W 400 S
- 876 N 75 W Unit 9
- 967 N 75 W Unit 63
- 59 W 1050 N Unit 18
- 993 N 75 W Unit 64
- 948 N 75 W Unit 11
- 42 W 850 N Unit 5
- 1044 N 75 W Unit 15
- 850 N 51 W Unit 59
- 74 W 850 N Unit 7
- 915 N 75 W Unit 61
- 850 N 73 W Unit 60
- 26 W 850 N Unit 4
- 1045 N 75 W Unit 66
- 1052 N 75 W Unit 16
- 996 N 75 W Unit 13
- 972 N 75 W Unit 12
- 924 N 75 W Unit 10
- 484 N Main St Unit 72
- 484 N Main St
- 420 N Main St
- 515 Pheasant Hollow Ln
- 475 N Main St
- 465 N Main St
- 50 E 500 N
- 11 E 400 N
- 435 N Main St
- 535 Pheasant Hollow Ln Unit 70
- 535 Pheaant Hollow Ln
- 25 W 400 N
- 53 E 400 N
- 520 Pheasant Hollow Ln
- 65 E 500 N
- 510 Pheasant Hollow Ln
- 73 E 400 N
- 43 W 400 N
- 545 Pheasant Hollow Ln
- 497 N 100 E
Your Personal Tour Guide
Ask me questions while you tour the home.