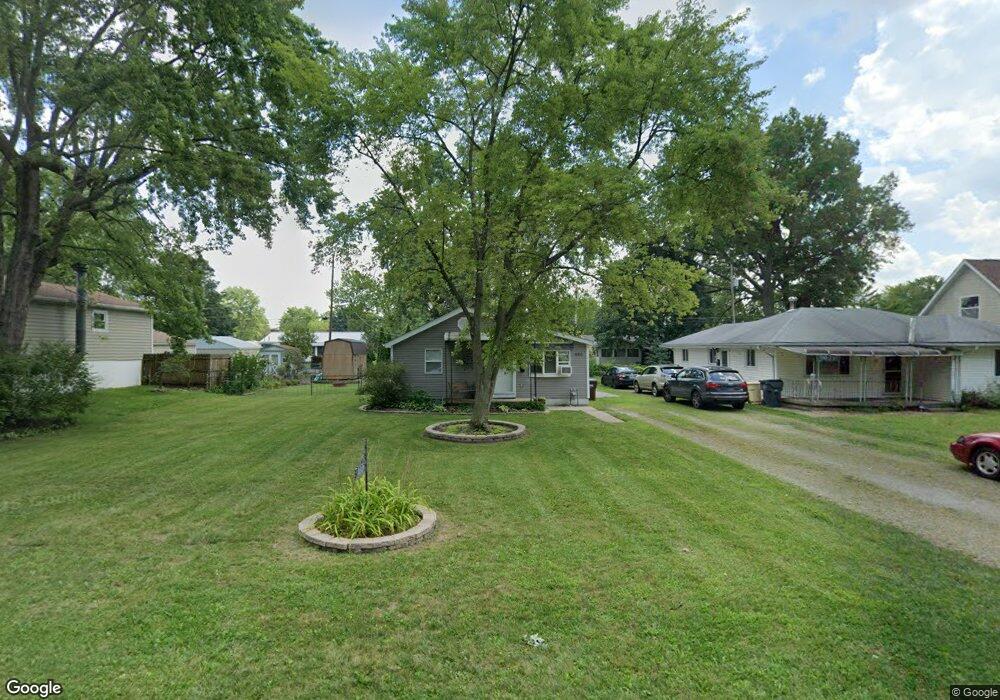
480 Pasadena Ave Columbus, OH 43228
Estimated Value: $139,372 - $200,000
2
Beds
1
Bath
752
Sq Ft
$214/Sq Ft
Est. Value
About This Home
This home is located at 480 Pasadena Ave, Columbus, OH 43228 and is currently estimated at $160,843, approximately $213 per square foot. 480 Pasadena Ave is a home located in Franklin County with nearby schools including Prairie Lincoln Elementary School, Galloway Ridge Intermediate School, and Norton Middle School.
Ownership History
Date
Name
Owned For
Owner Type
Purchase Details
Closed on
Jun 12, 2003
Sold by
Henderson Paula J and Henderson Jeffery
Bought by
Yakubowski Jacqueline K
Current Estimated Value
Home Financials for this Owner
Home Financials are based on the most recent Mortgage that was taken out on this home.
Original Mortgage
$77,647
Outstanding Balance
$32,185
Interest Rate
5.51%
Mortgage Type
FHA
Estimated Equity
$128,658
Purchase Details
Closed on
Aug 8, 2001
Sold by
Byrum Dwayne A
Bought by
Byrum Paula J
Purchase Details
Closed on
Nov 15, 1999
Sold by
Stogner Helen L
Bought by
Byrum Dwayne A and Byrum Paula J
Home Financials for this Owner
Home Financials are based on the most recent Mortgage that was taken out on this home.
Original Mortgage
$53,558
Interest Rate
7.81%
Mortgage Type
FHA
Purchase Details
Closed on
Mar 5, 1993
Bought by
Stogner Helen L Afdt
Create a Home Valuation Report for This Property
The Home Valuation Report is an in-depth analysis detailing your home's value as well as a comparison with similar homes in the area
Home Values in the Area
Average Home Value in this Area
Purchase History
| Date | Buyer | Sale Price | Title Company |
|---|---|---|---|
| Yakubowski Jacqueline K | $78,900 | Chicago Title | |
| Byrum Paula J | $2,500 | -- | |
| Byrum Dwayne A | $54,000 | Contract Processing & Title | |
| Stogner Helen L Afdt | -- | -- |
Source: Public Records
Mortgage History
| Date | Status | Borrower | Loan Amount |
|---|---|---|---|
| Open | Yakubowski Jacqueline K | $77,647 | |
| Previous Owner | Byrum Dwayne A | $53,558 |
Source: Public Records
Tax History
| Year | Tax Paid | Tax Assessment Tax Assessment Total Assessment is a certain percentage of the fair market value that is determined by local assessors to be the total taxable value of land and additions on the property. | Land | Improvement |
|---|---|---|---|---|
| 2025 | $2,042 | $44,980 | $16,770 | $28,210 |
| 2024 | $2,042 | $44,980 | $16,770 | $28,210 |
| 2023 | $1,956 | $44,975 | $16,765 | $28,210 |
| 2022 | $1,342 | $21,560 | $4,900 | $16,660 |
| 2021 | $1,364 | $21,560 | $4,900 | $16,660 |
| 2020 | $1,347 | $21,560 | $4,900 | $16,660 |
| 2019 | $1,323 | $18,490 | $4,100 | $14,390 |
| 2018 | $1,393 | $18,490 | $4,100 | $14,390 |
| 2017 | $1,257 | $18,490 | $4,100 | $14,390 |
| 2016 | $1,475 | $19,880 | $6,090 | $13,790 |
| 2015 | $1,475 | $19,880 | $6,090 | $13,790 |
| 2014 | $1,453 | $19,880 | $6,090 | $13,790 |
| 2013 | $869 | $23,380 | $7,175 | $16,205 |
Source: Public Records
Map
Nearby Homes
- 443 Lawrence Ave
- 396 Pasadena Ave
- 495 Lennox Ave
- 381 Pasadena Ave
- 389 Deerfield Rd
- 4899 Hamden Way
- 463 Darbyhurst Rd
- 305 Danhurst Rd
- 417 Revere Ct
- 348 Darbyhurst Rd
- 5409 Longworth Dr
- 199 N Murray Hill Rd
- 399 Carilla Ln
- 69 Lawrence Ave
- 5345 Cypress Chase Unit 5345
- 5713 Larksdale Dr
- 464 Yarmouth Ln
- 5412 Cedar Springs Unit 5412A
- 5488 Cypress Chase Unit 5488
- 97 Tarryton Ct W Unit 19-H
- 476 Pasadena Ave
- 494 Pasadena Ave
- 470 Pasadena Ave
- 502 Pasadena Ave
- 0 Maple Dr
- 485 Maple Dr
- 465 Maple Dr
- 489 Pasadena Ave
- 491 Maple Dr
- 464 Pasadena Ave
- 481 Pasadena Ave
- 493 Pasadena Ave
- 508 Pasadena Ave
- 473 Pasadena Ave
- 501 Pasadena Ave
- 451 Maple Dr
- 499 Maple Dr
- 450 Pasadena Ave
- 465 Pasadena Ave
- 445 Maple Dr
Your Personal Tour Guide
Ask me questions while you tour the home.