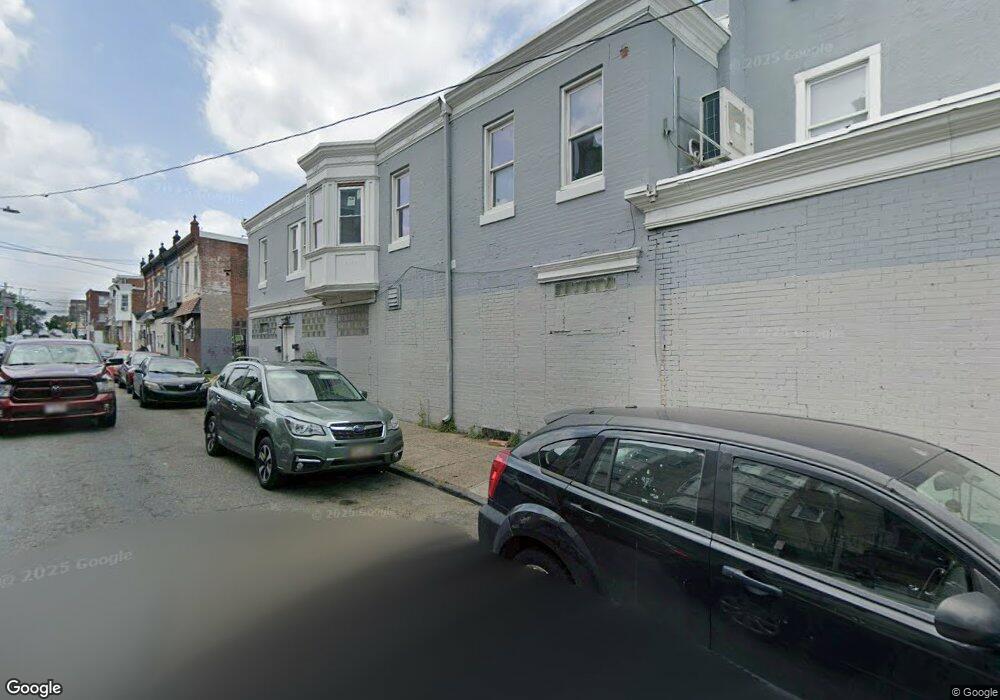
4800 Frankford Ave Unit 3 Philadelphia, PA 19124
Frankford NeighborhoodEstimated Value: $471,299
2
Beds
1
Bath
1,600
Sq Ft
$295/Sq Ft
Est. Value
About This Home
This home is located at 4800 Frankford Ave Unit 3, Philadelphia, PA 19124 and is currently estimated at $471,299, approximately $294 per square foot. 4800 Frankford Ave Unit 3 is a home located in Philadelphia County with nearby schools including Frankford High School, The Philadelphia Charter School for the Arts & Sciences, and Maritime Academy.
Ownership History
Date
Name
Owned For
Owner Type
Purchase Details
Closed on
Jun 13, 2019
Sold by
Etai & Noor Inc
Bought by
Holland Homes 1 Llc
Current Estimated Value
Home Financials for this Owner
Home Financials are based on the most recent Mortgage that was taken out on this home.
Original Mortgage
$220,000
Outstanding Balance
$192,635
Interest Rate
4%
Mortgage Type
Commercial
Estimated Equity
$278,664
Purchase Details
Closed on
Jun 12, 2013
Sold by
James Jano
Bought by
Etai & Noor Inc
Purchase Details
Closed on
Oct 30, 2012
Sold by
Zhang Li Qin
Bought by
James Jano
Purchase Details
Closed on
Nov 17, 2011
Sold by
Meadows David J and Meadows Barbara
Bought by
Zhang Li Qin
Purchase Details
Closed on
Sep 30, 1996
Sold by
Snead Arthur and Snead Arthur V
Bought by
Meadows David J and Meadows Barbara
Create a Home Valuation Report for This Property
The Home Valuation Report is an in-depth analysis detailing your home's value as well as a comparison with similar homes in the area
Home Values in the Area
Average Home Value in this Area
Purchase History
| Date | Buyer | Sale Price | Title Company |
|---|---|---|---|
| Holland Homes 1 Llc | $275,000 | First Partners Abstract Co | |
| Etai & Noor Inc | $85,000 | None Available | |
| James Jano | $70,000 | None Available | |
| Zhang Li Qin | $55,000 | None Available | |
| Meadows David J | $55,000 | -- |
Source: Public Records
Mortgage History
| Date | Status | Borrower | Loan Amount |
|---|---|---|---|
| Open | Holland Homes 1 Llc | $220,000 |
Source: Public Records
Tax History Compared to Growth
Tax History
| Year | Tax Paid | Tax Assessment Tax Assessment Total Assessment is a certain percentage of the fair market value that is determined by local assessors to be the total taxable value of land and additions on the property. | Land | Improvement |
|---|---|---|---|---|
| 2026 | $2,128 | $173,600 | $34,720 | $138,880 |
| 2025 | $2,128 | $173,600 | $34,720 | $138,880 |
| 2024 | $2,128 | $173,600 | $34,720 | $138,880 |
| 2023 | $2,128 | $152,000 | $30,400 | $121,600 |
| 2022 | $2,878 | $152,000 | $30,400 | $121,600 |
| 2021 | $2,878 | $0 | $0 | $0 |
| 2020 | $2,878 | $0 | $0 | $0 |
| 2019 | $2,850 | $0 | $0 | $0 |
| 2018 | $2,767 | $0 | $0 | $0 |
| 2017 | $1,408 | $0 | $0 | $0 |
| 2016 | $9,830 | $0 | $0 | $0 |
| 2015 | $9,830 | $0 | $0 | $0 |
| 2014 | -- | $100,600 | $20,800 | $79,800 |
| 2012 | -- | $20,160 | $10,080 | $10,080 |
Source: Public Records
Map
Nearby Homes
- 4735 Frankford Ave
- 1629 Foulkrod St
- 1519 Foulkrod St
- 1636 Fillmore St
- 1615 Fillmore St
- 1515 Foulkrod St
- 1626 Margaret St
- 1636 Margaret St
- 4814 Griscom St
- 4712 Griscom St
- 4839 Griscom St
- 4734 44 Oxford Ave
- 1516 Arrott St
- 4720 Penn St
- 1688 Fillmore St
- 4666 Duffield St
- 4665 Leiper St
- 1518 Overington St
- 4843 Duffield St
- 4714 Hawthorne St
- 4800 Frankford Ave
- 4802 Frankford Ave
- 4804 Frankford Ave
- 4804 Frankford Ave Unit 2ND FLOOR REAR
- 4804 Frankford Ave Unit 2ND FLOOR FRONT
- 4804 Frankford Ave Unit 3RD FLOOR REAR
- 4804 Frankford Ave Unit 3RD FLOOR FRONT
- 4804 Frankford Ave Unit 2ND FLOOR
- 4804 Frankford Ave Unit 3RD FLOOR
- 4804 Frankford Ave Unit STOREFRONT
- 4750 Frankford Ave
- 1535 Foulkrod St
- 1538 Foulkrod St
- 1533 Foulkrod St
- 1536 Foulkrod St
- 1534 Foulkrod St
- 1531 Foulkrod St
- 1532 Foulkrod St
- 1529 Foulkrod St
- 1530 Foulkrod St