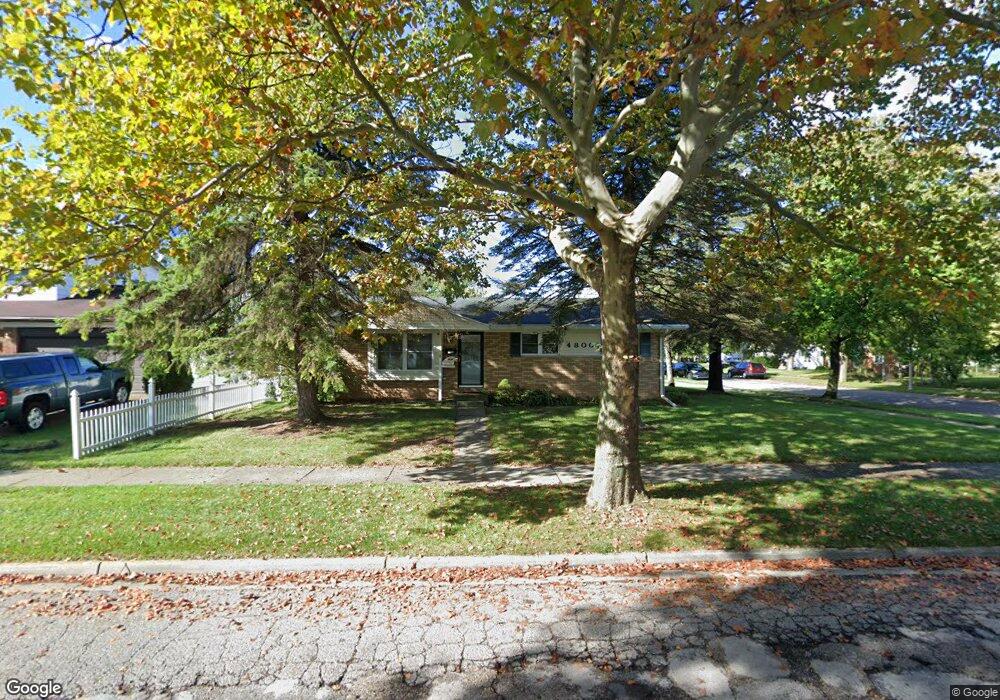
4800 Stillwell Ave Lansing, MI 48911
Churchill Downs NeighborhoodEstimated Value: $153,000 - $186,000
3
Beds
2
Baths
2,050
Sq Ft
$83/Sq Ft
Est. Value
About This Home
This home is located at 4800 Stillwell Ave, Lansing, MI 48911 and is currently estimated at $169,461, approximately $82 per square foot. 4800 Stillwell Ave is a home located in Ingham County with nearby schools including Reo Elementary School, Attwood School, and Everett High School.
Ownership History
Date
Name
Owned For
Owner Type
Purchase Details
Closed on
Nov 21, 2023
Sold by
Kerrin Dorice L
Bought by
Kerrin Dorice L
Current Estimated Value
Home Financials for this Owner
Home Financials are based on the most recent Mortgage that was taken out on this home.
Original Mortgage
$112,000
Outstanding Balance
$107,316
Interest Rate
7.63%
Mortgage Type
New Conventional
Estimated Equity
$62,145
Purchase Details
Closed on
Mar 11, 2008
Sold by
Glenn L Orler Revocable Trust
Bought by
Kerrin Dorrice L
Home Financials for this Owner
Home Financials are based on the most recent Mortgage that was taken out on this home.
Original Mortgage
$103,377
Interest Rate
5.74%
Mortgage Type
FHA
Purchase Details
Closed on
Mar 1, 2007
Sold by
Orler Glenn L
Bought by
The Glenn L Orler Revocable Trust
Purchase Details
Closed on
Jun 6, 2003
Sold by
Perreault Philippe H and Perreault Patricia A
Bought by
Orler Glenn L
Create a Home Valuation Report for This Property
The Home Valuation Report is an in-depth analysis detailing your home's value as well as a comparison with similar homes in the area
Home Values in the Area
Average Home Value in this Area
Purchase History
| Date | Buyer | Sale Price | Title Company |
|---|---|---|---|
| Kerrin Dorice L | -- | Vantage Point Title Inc | |
| Kerrin Dorrice L | $105,000 | First American Title Ins Co | |
| The Glenn L Orler Revocable Trust | -- | None Available | |
| Orler Glenn L | $100,000 | -- |
Source: Public Records
Mortgage History
| Date | Status | Borrower | Loan Amount |
|---|---|---|---|
| Open | Kerrin Dorice L | $112,000 | |
| Previous Owner | Kerrin Dorrice L | $103,377 |
Source: Public Records
Tax History Compared to Growth
Tax History
| Year | Tax Paid | Tax Assessment Tax Assessment Total Assessment is a certain percentage of the fair market value that is determined by local assessors to be the total taxable value of land and additions on the property. | Land | Improvement |
|---|---|---|---|---|
| 2025 | $3,036 | $76,500 | $10,400 | $66,100 |
| 2024 | $24 | $71,000 | $10,400 | $60,600 |
| 2023 | $2,847 | $62,500 | $10,400 | $52,100 |
| 2022 | $2,566 | $55,000 | $10,400 | $44,600 |
| 2021 | $2,513 | $50,200 | $6,600 | $43,600 |
| 2020 | $2,498 | $47,400 | $6,600 | $40,800 |
| 2019 | $2,394 | $46,000 | $6,600 | $39,400 |
| 2018 | $2,244 | $41,200 | $6,600 | $34,600 |
| 2017 | $2,148 | $41,200 | $6,600 | $34,600 |
| 2016 | $2,054 | $38,300 | $6,600 | $31,700 |
| 2015 | $2,054 | $37,300 | $13,200 | $24,100 |
| 2014 | $2,054 | $36,400 | $20,842 | $15,558 |
Source: Public Records
Map
Nearby Homes
- 5100 Wexford Rd
- 3600 Ronald St
- 4809 Ballard Rd
- 3115 Risdale Ave
- 4828 Ingham St
- 4000 Churchill Ave
- 2416 Midwood St
- 2816 Greenbelt Dr
- 4328 Chadburne Dr
- 4018 Clayborn Rd
- 5424 S Waverly Rd
- 3006 Hillcrest St
- 4009 Heathgate Dr
- 4628 Pleasant Grove Rd
- 2311 Greenbelt Dr
- 4110 Richmond St
- 4017 Richmond St
- 3100 Glenbrook Dr
- 4107 Windward Dr
- 4317 Seaway Dr
- 4810 Stillwell Ave
- 3415 Karen St
- 4816 Stillwell Ave
- 4720 Stillwell Ave
- 3421 Karen St
- 4801 Stillwell Ave
- 3414 Karen St
- 4811 Stillwell Ave
- 4822 Stillwell Ave
- 4714 Stillwell Ave
- 3425 Karen St
- 4817 Stillwell Ave
- 3324 Karen St
- 3420 Karen St
- 3426 Lucie St
- 4710 Stillwell Ave
- 3431 Karen St
- 3424 Karen St
- 4823 Stillwell Ave
- 3315 Karen St