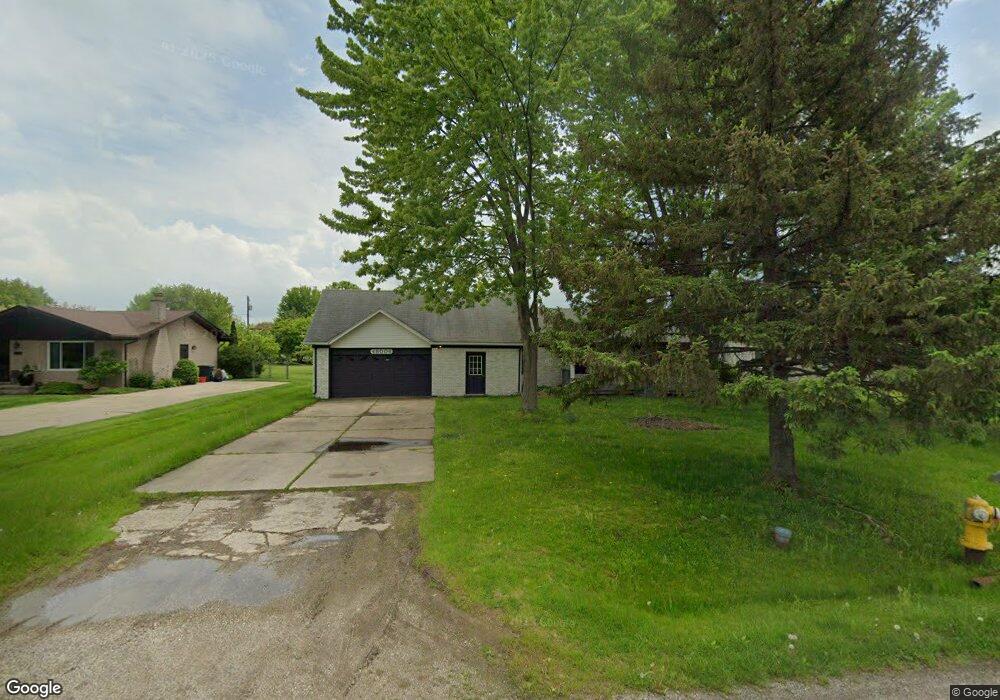
48008 Forbes St Unit Bldg-Unit Chesterfield, MI 48047
Estimated Value: $287,000 - $349,000
3
Beds
2
Baths
1,959
Sq Ft
$160/Sq Ft
Est. Value
About This Home
This home is located at 48008 Forbes St Unit Bldg-Unit, Chesterfield, MI 48047 and is currently estimated at $314,286, approximately $160 per square foot. 48008 Forbes St Unit Bldg-Unit is a home located in Macomb County with nearby schools including Dean A. Naldrett School, Anchor Bay Middle School South, and Anchor Bay High School.
Ownership History
Date
Name
Owned For
Owner Type
Purchase Details
Closed on
Jun 23, 2023
Sold by
Bell Cheryl
Bought by
Gunter Yolanda
Current Estimated Value
Home Financials for this Owner
Home Financials are based on the most recent Mortgage that was taken out on this home.
Original Mortgage
$155,000
Outstanding Balance
$150,830
Interest Rate
6.57%
Mortgage Type
New Conventional
Estimated Equity
$163,456
Purchase Details
Closed on
Aug 10, 2022
Sold by
Kiavi Properties Llc
Bought by
Bell Cheryl
Purchase Details
Closed on
Nov 12, 2021
Sold by
Infinity Investing Llc
Bought by
Lendinghome Funding Corp
Purchase Details
Closed on
Dec 14, 2018
Sold by
Elizabeth J Kucharek Revocable Living Tr
Bought by
Infinity Investing Llc
Create a Home Valuation Report for This Property
The Home Valuation Report is an in-depth analysis detailing your home's value as well as a comparison with similar homes in the area
Home Values in the Area
Average Home Value in this Area
Purchase History
| Date | Buyer | Sale Price | Title Company |
|---|---|---|---|
| Gunter Yolanda | $245,000 | Devon Title | |
| Gunter Yolanda | $245,000 | Devon Title | |
| Bell Cheryl | $130,500 | -- | |
| Bell Cheryl | $130,500 | Servicelink | |
| Kiavi Properties Llc | -- | -- | |
| Kiavi Properties Llc | -- | None Listed On Document | |
| Lendinghome Funding Corp | $211,473 | None Available | |
| Infinity Investing Llc | $115,000 | Bell Title Agency |
Source: Public Records
Mortgage History
| Date | Status | Borrower | Loan Amount |
|---|---|---|---|
| Open | Gunter Yolanda | $155,000 |
Source: Public Records
Tax History Compared to Growth
Tax History
| Year | Tax Paid | Tax Assessment Tax Assessment Total Assessment is a certain percentage of the fair market value that is determined by local assessors to be the total taxable value of land and additions on the property. | Land | Improvement |
|---|---|---|---|---|
| 2025 | $5,027 | $142,100 | $0 | $0 |
| 2024 | $2,895 | $134,900 | $0 | $0 |
| 2023 | $3,479 | $114,600 | $0 | $0 |
| 2022 | $2,983 | $105,600 | $0 | $0 |
| 2021 | $5,552 | $100,500 | $0 | $0 |
| 2020 | $2,799 | $93,700 | $0 | $0 |
| 2019 | $5,013 | $89,800 | $0 | $0 |
| 2018 | $2,474 | $84,800 | $16,300 | $68,500 |
| 2017 | $2,447 | $78,800 | $16,250 | $62,550 |
| 2016 | $1,045 | $78,800 | $0 | $0 |
| 2015 | $1,045 | $69,900 | $0 | $0 |
| 2014 | $1,045 | $67,550 | $13,750 | $53,800 |
| 2012 | -- | $0 | $0 | $0 |
Source: Public Records
Map
Nearby Homes
- 48041 Sugarbush Rd
- 47812 Forbes Dr
- 47978 Jefferson Ave
- 47685 Jefferson Ave
- 29705 Alexandra Ln Unit 13
- 50426 Jim Dr
- 50013 S Jimmy Ct
- 29213 Rachid Ln
- 48526 Jefferson Ave
- 29371 Bayside Cir N
- 48556 Harbor Dr
- 28734 Yarmouth Ct Unit 18
- 28771 Squire Dr
- 50218 N Benny Ct
- 28715 Portsmouth Ct Unit 32
- 50131 N Benny Ct
- 47460 Sugarbush Rd
- 48713 Chelmsford Ct Unit 127
- 48832 Birmingham Dr
- 29126 Brooke Meadows Ct
- 48008 Forbes St
- 48000 Forbes St
- 48018 Forbes Dr
- 48037 Mallard Dr
- 48028 Forbes Dr
- 47990 Forbes St
- 48045 Mallard Dr
- 48036 Forbes Dr
- 48027 Mallard Dr
- 47980 Forbes Dr
- 48017 Mallard Dr
- 0 Forbes Unit 215097600
- 0 Forbes Unit 31348222
- 0 Forbes Unit 885800
- 0 Forbes Unit 885802
- 0 Forbes Unit 885801
- 0 Forbes Unit 885803
- 0 Forbes Unit 885898
- 0 Forbes Unit 885897
- 0 Forbes Unit 885896