F
Seller's Agent in 2016
FRANK GROUNDS
MCCOLLUM REAL ESTATE

Estimated Value: $156,000 - $257,000
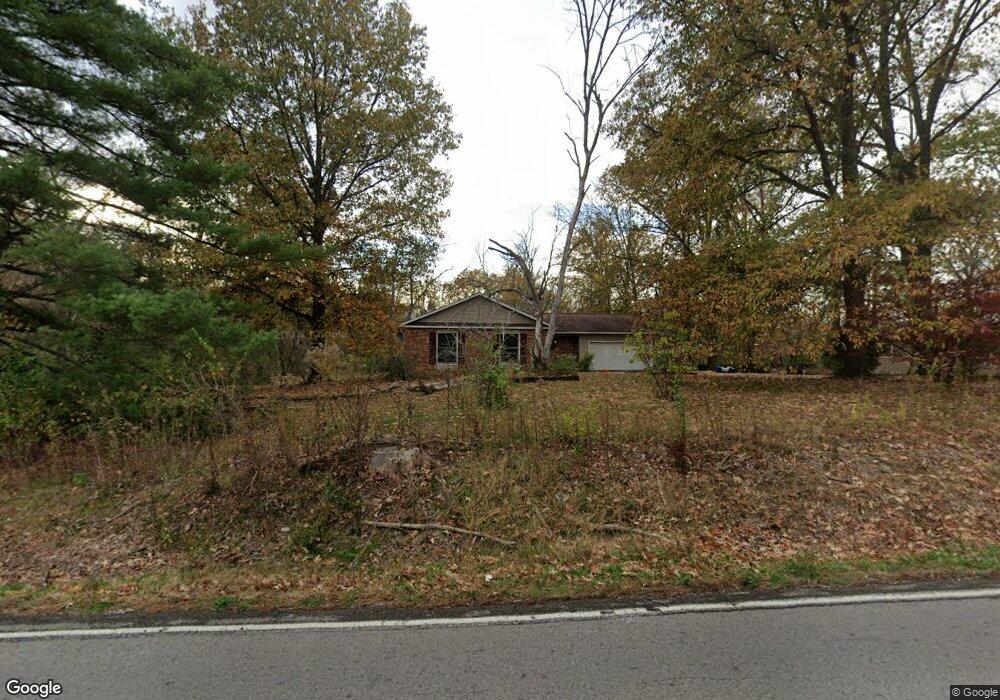
2009 new kitchen counter tops/sink & all kitchen appliances,hot water heater 24 X 40 pole barn with electric & concrete floor, 2010 new exterior deck and 12 X 16 sun room,2012 New roof, storm shelter new heat pump & furnace. 2015 new septic lines to s tank and lagoon, has water filter on kitchen faucet. Back yard is country/wooded view, on a deck that features pergola and retractable sun shade. stove/oven, Microwave,Refrigerator, dishwasher,stack washer/dryer,2 upright freeezers,Storm shelter,ceiling fans, deck furniture, 2 swing&frames, 10'X10' garden shed, garage door openers.
Last Agent to Sell the Property
FRANK GROUNDS
MCCOLLUM REAL ESTATE License #475157844 Listed on: 06/15/2016
Last Buyer's Agent
CHERYL RUZICH
Pisoni Real Estate License #471004529
| Date | Event | Price | List to Sale | Price per Sq Ft |
|---|---|---|---|---|
| 10/21/2016 10/21/16 | Sold | $149,500 | 0.0% | $87 / Sq Ft |
| 09/07/2016 09/07/16 | Pending | -- | -- | -- |
| 06/15/2016 06/15/16 | For Sale | $149,500 | -- | $87 / Sq Ft |
| Year | Tax Paid | Tax Assessment Tax Assessment Total Assessment is a certain percentage of the fair market value that is determined by local assessors to be the total taxable value of land and additions on the property. | Land | Improvement |
|---|---|---|---|---|
| 2024 | $1,474 | $29,980 | $1,525 | $28,455 |
| 2023 | $1,413 | $28,825 | $1,465 | $27,360 |
| 2022 | $1,338 | $26,690 | $1,355 | $25,335 |
| 2021 | $1,274 | $24,715 | $1,255 | $23,460 |
| 2020 | $1,272 | $24,915 | $1,265 | $23,650 |
| 2019 | $1,227 | $25,200 | $1,280 | $23,920 |
| 2018 | $1,130 | $24,230 | $1,230 | $23,000 |
| 2017 | $1,057 | $22,370 | $1,135 | $21,235 |
| 2016 | $1,130 | $22,370 | $1,135 | $21,235 |
| 2015 | $1,039 | $22,370 | $1,135 | $21,235 |
| 2014 | $1,077 | $22,370 | $1,135 | $21,235 |
| 2013 | $1,118 | $22,370 | $1,135 | $21,235 |
F
Seller's Agent in 2016
FRANK GROUNDS
MCCOLLUM REAL ESTATE
C
Buyer's Agent in 2016
CHERYL RUZICH
Pisoni Real Estate
Source: RMLS Alliance
MLS Number: RMAEB406847
APN: 12-09-101-005
Disclaimer: Certain information contained herein is derived from information provided by parties other than Homes.com. All information provided is deemed reliable, but is not guaranteed to be accurate and should be independently verified.
![]() Based on information submitted to the MLS GRID. All data is obtained from various sources and may not have been verified by broker or MLS GRID. Supplied Open House Information is subject to change without notice. All information should be independently reviewed and verified for accuracy. Properties may or may not be listed by the office/agent presenting the information. Some IDX listings have been excluded from this website.IDX information is provided exclusively for personal, non-commercial use, and may not be used for any purpose other than to identify prospective properties consumers may be interested in purchasing. Information is deemed reliable but not guaranteed.
Based on information submitted to the MLS GRID. All data is obtained from various sources and may not have been verified by broker or MLS GRID. Supplied Open House Information is subject to change without notice. All information should be independently reviewed and verified for accuracy. Properties may or may not be listed by the office/agent presenting the information. Some IDX listings have been excluded from this website.IDX information is provided exclusively for personal, non-commercial use, and may not be used for any purpose other than to identify prospective properties consumers may be interested in purchasing. Information is deemed reliable but not guaranteed.
Based on information submitted to the MLS GRID
Ask me questions while you tour the home.