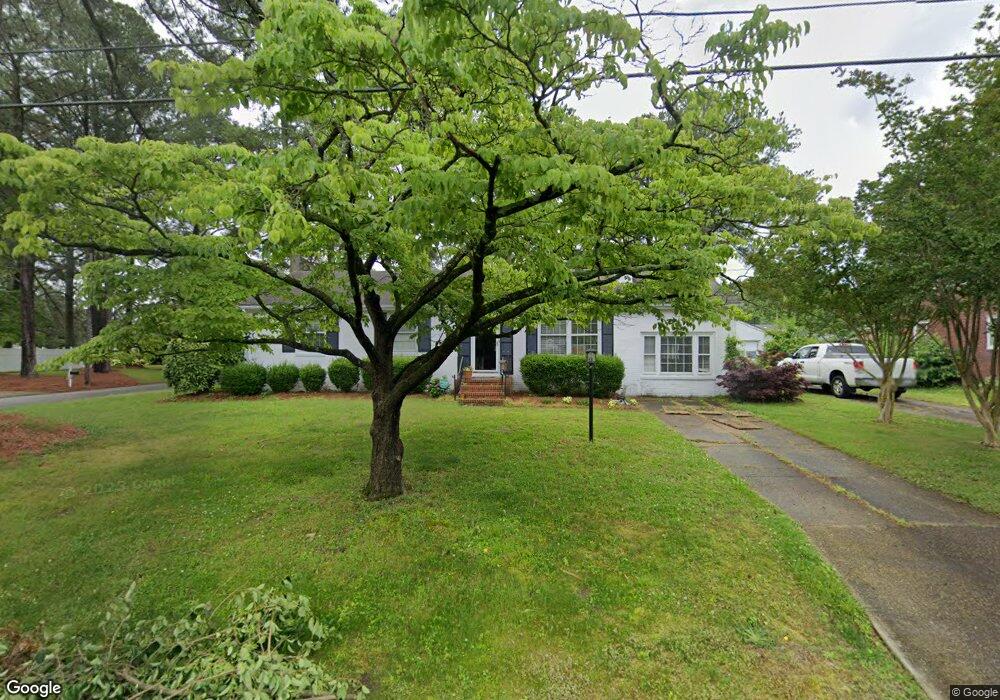
4801 Milan Dr Portsmouth, VA 23703
Churchland NeighborhoodEstimated Value: $187,000 - $348,000
3
Beds
2
Baths
1,539
Sq Ft
$193/Sq Ft
Est. Value
About This Home
This home is located at 4801 Milan Dr, Portsmouth, VA 23703 and is currently estimated at $297,147, approximately $193 per square foot. 4801 Milan Dr is a home located in Portsmouth City with nearby schools including Churchland Elementary School, Churchland Academy Elementary School, and Churchland Middle School.
Ownership History
Date
Name
Owned For
Owner Type
Purchase Details
Closed on
Jul 3, 2025
Sold by
Lewark Jacquelyn Adams and Lewark Jackie
Bought by
Hassell Stephen and Hassell Cynthia Dawn
Current Estimated Value
Home Financials for this Owner
Home Financials are based on the most recent Mortgage that was taken out on this home.
Original Mortgage
$128,000
Outstanding Balance
$127,784
Interest Rate
6.86%
Mortgage Type
New Conventional
Estimated Equity
$169,363
Purchase Details
Closed on
Jun 27, 2013
Sold by
Spence Kathryn E
Bought by
Lewark Larry
Purchase Details
Closed on
Jan 6, 2010
Sold by
Vass Helen and Williams William A
Bought by
Spence Kathryn E
Home Financials for this Owner
Home Financials are based on the most recent Mortgage that was taken out on this home.
Original Mortgage
$146,400
Interest Rate
4.78%
Mortgage Type
New Conventional
Create a Home Valuation Report for This Property
The Home Valuation Report is an in-depth analysis detailing your home's value as well as a comparison with similar homes in the area
Home Values in the Area
Average Home Value in this Area
Purchase History
| Date | Buyer | Sale Price | Title Company |
|---|---|---|---|
| Hassell Stephen | $160,000 | Fidelity National Title | |
| Lewark Larry | $200,000 | -- | |
| Spence Kathryn E | $183,000 | -- |
Source: Public Records
Mortgage History
| Date | Status | Borrower | Loan Amount |
|---|---|---|---|
| Open | Hassell Stephen | $128,000 | |
| Previous Owner | Spence Kathryn E | $146,400 |
Source: Public Records
Tax History Compared to Growth
Tax History
| Year | Tax Paid | Tax Assessment Tax Assessment Total Assessment is a certain percentage of the fair market value that is determined by local assessors to be the total taxable value of land and additions on the property. | Land | Improvement |
|---|---|---|---|---|
| 2025 | $3,681 | $293,500 | $89,100 | $204,400 |
| 2024 | $3,681 | $285,340 | $89,100 | $196,240 |
| 2023 | $3,482 | $278,540 | $89,100 | $189,440 |
| 2022 | $3,163 | $243,290 | $74,250 | $169,040 |
| 2021 | $2,725 | $209,640 | $52,830 | $156,810 |
| 2020 | $2,693 | $207,120 | $50,310 | $156,810 |
| 2019 | $2,675 | $205,760 | $50,310 | $155,450 |
| 2018 | $2,622 | $201,680 | $50,310 | $151,370 |
| 2017 | $2,586 | $198,960 | $50,310 | $148,650 |
| 2016 | $2,586 | $198,960 | $50,310 | $148,650 |
| 2015 | $2,586 | $198,960 | $50,310 | $148,650 |
| 2014 | $2,524 | $198,770 | $50,310 | $148,460 |
Source: Public Records
Map
Nearby Homes
- 4808 Thornwood St
- 4955 Briarwood Ln
- 3728 Cardinal Ln
- 4959 Briarwood Ln
- 3613 Cardinal Ln
- 10AC Cedar Ln
- 3509 Spence Rd
- 3609 Linnet Ln
- 4705 Templar Dr
- 3609 Loon Ct
- 4613 Mallard Crescent
- 5300 Larkspur Rd
- 3425 Cedar Ln
- 3405 Canterbury Dr
- 3408 Wakefield Dr
- 2004 Sawgrass Ln
- 4313 Templar Dr
- 4412 Carlton Ct
- 5220 Clover Hill Dr
- 3200 Westwood Crescent
- 4805 Milan Dr
- 3740 Shannon Rd
- 3736 Shannon Rd
- 3800 Shannon Rd
- 3761 Shannon Rd
- 4809 Milan Dr
- 4804 Milan Dr
- 3753 Shannon Rd
- 3732 Shannon Rd
- 3801 Shannon Rd
- 3804 Shannon Rd
- 4813 Milan Dr
- 3805 Westcott Rd
- 3728 Shannon Rd
- 3724 Burr Ln
- 3722 Burr Ln
- 3805 Shannon Rd
- 3749 Shannon Rd
- 3745 Shannon Rd
- 3741 Shannon Rd