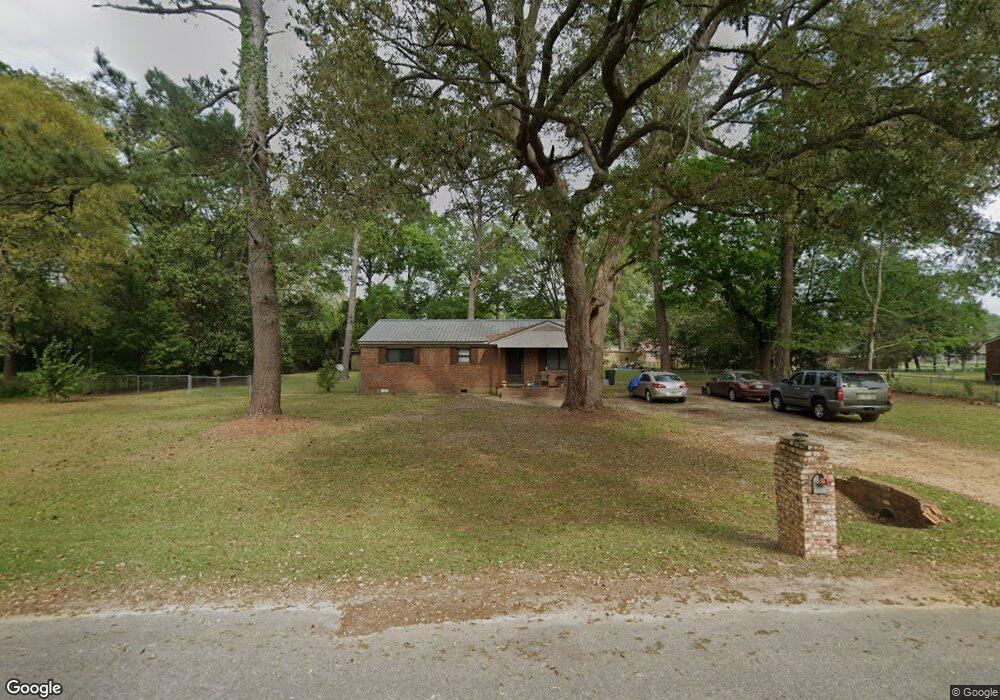
4802 Folly Dr Albany, GA 31705
Estimated Value: $80,000 - $124,000
3
Beds
1
Bath
1,170
Sq Ft
$85/Sq Ft
Est. Value
About This Home
This home is located at 4802 Folly Dr, Albany, GA 31705 and is currently estimated at $99,308, approximately $84 per square foot. 4802 Folly Dr is a home located in Dougherty County with nearby schools including Radium Springs Elementary School, Radium Springs Middle School, and Albany Middle School.
Ownership History
Date
Name
Owned For
Owner Type
Purchase Details
Closed on
May 31, 2018
Sold by
Home Liv Solutions Llc
Bought by
H
Current Estimated Value
Purchase Details
Closed on
Dec 2, 2015
Sold by
Moore Detra
Bought by
Moore Eddie D
Purchase Details
Closed on
May 2, 2013
Sold by
Moore Eddie
Bought by
Home Liv Solutoins Llc
Purchase Details
Closed on
Dec 30, 2011
Sold by
Lendmark Financial Services Inc
Bought by
Moore Eddie D and Moore Detra D
Home Financials for this Owner
Home Financials are based on the most recent Mortgage that was taken out on this home.
Original Mortgage
$24,720
Interest Rate
4.07%
Mortgage Type
New Conventional
Purchase Details
Closed on
Feb 9, 2011
Sold by
Baxley John L
Bought by
Lendmark Financial Services Inc
Purchase Details
Closed on
May 2, 2000
Sold by
Craft Thomas D and Craft Dolly F
Bought by
Baxley John L
Purchase Details
Closed on
Oct 14, 1977
Sold by
Woodall Johnny M
Bought by
Craft Thomas and Craft Dolly
Create a Home Valuation Report for This Property
The Home Valuation Report is an in-depth analysis detailing your home's value as well as a comparison with similar homes in the area
Home Values in the Area
Average Home Value in this Area
Purchase History
| Date | Buyer | Sale Price | Title Company |
|---|---|---|---|
| H | $65,000 | -- | |
| Moore Eddie D | -- | -- | |
| Home Liv Solutoins Llc | -- | -- | |
| Moore Eddie D | $30,900 | -- | |
| Lendmark Financial Services Inc | $40,000 | -- | |
| Baxley John L | $52,900 | -- | |
| Craft Thomas | -- | -- |
Source: Public Records
Mortgage History
| Date | Status | Borrower | Loan Amount |
|---|---|---|---|
| Previous Owner | Moore Eddie D | $24,720 |
Source: Public Records
Tax History Compared to Growth
Tax History
| Year | Tax Paid | Tax Assessment Tax Assessment Total Assessment is a certain percentage of the fair market value that is determined by local assessors to be the total taxable value of land and additions on the property. | Land | Improvement |
|---|---|---|---|---|
| 2024 | $935 | $20,240 | $4,080 | $16,160 |
| 2023 | $936 | $20,240 | $4,080 | $16,160 |
| 2022 | $938 | $20,240 | $4,080 | $16,160 |
| 2021 | $868 | $20,240 | $4,080 | $16,160 |
| 2020 | $870 | $20,240 | $4,080 | $16,160 |
| 2019 | $517 | $20,240 | $4,080 | $16,160 |
| 2018 | $874 | $20,240 | $4,080 | $16,160 |
| 2017 | $813 | $20,240 | $4,080 | $16,160 |
| 2016 | $814 | $20,240 | $4,080 | $16,160 |
| 2015 | $815 | $20,240 | $4,080 | $16,160 |
| 2014 | $818 | $20,600 | $4,440 | $16,160 |
Source: Public Records
Map
Nearby Homes
- 4819 Impala Ln
- 4811 Mustang Dr
- 4830 Impala Ln
- 4713 Cooper St
- 2408 Liberty Expy
- 4431 Stagecoach Rd
- 4411 Nichols St
- 1224 Nixon Dr
- 1830 Liberty Expy SE
- 929 Nelms Rd
- 823 Shelton Dr
- 1508 Liberty Expy SE
- 3402 Radium Springs Rd
- 914 Barbragale Ave
- 509 521 Honeysuckle Rd
- 565 Nectar Ln
- 3678 Thronateeska Way
- 1461 Apache Rd
- 1110 Kreg Ave
- 454 Poinciana Ave
- 4804 Folly Dr
- 4800 Folly Dr
- 4805 Impala Ln
- 4803 Impala Ln
- 4807 Impala Ln
- 4801 Impala Ln
- 4803 Folly Dr
- 4809 Impala Ln
- 4805 Folly Dr
- 4806 Folly Dr
- 4801 Folly Dr
- 4807 Folly Dr
- 4811 Impala Ln
- LOT 310 Saville Ln
- 0 Impala Ln Unit 7377309
- 4804 Impala Ln
- 4802 Impala Ln
- 4806 Impala Ln
- 4808 Folly Dr
- 4800 Impala Ln