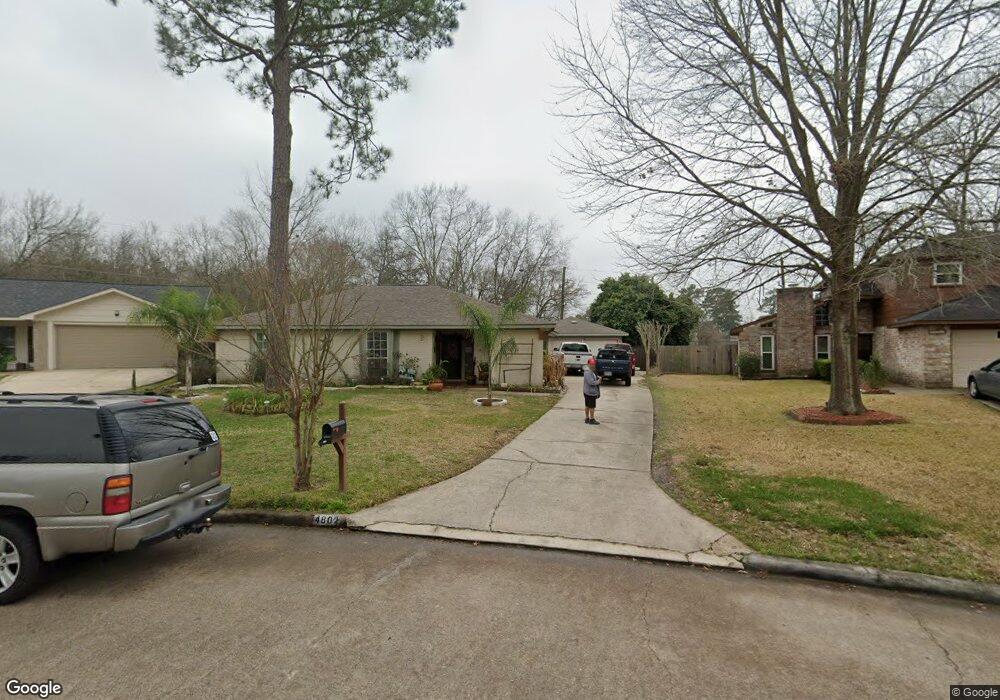
4802 Glendower Dr Spring, TX 77373
Estimated Value: $194,000 - $202,294
3
Beds
2
Baths
1,317
Sq Ft
$151/Sq Ft
Est. Value
About This Home
This home is located at 4802 Glendower Dr, Spring, TX 77373 and is currently estimated at $199,324, approximately $151 per square foot. 4802 Glendower Dr is a home located in Harris County with nearby schools including Mildred Jenkins Elementary School, Dueitt Middle School, and Spring High School.
Ownership History
Date
Name
Owned For
Owner Type
Purchase Details
Closed on
May 30, 2002
Sold by
Trujillo Mario and Trujillo Cynthia
Bought by
Leija Brisa
Current Estimated Value
Home Financials for this Owner
Home Financials are based on the most recent Mortgage that was taken out on this home.
Original Mortgage
$80,569
Outstanding Balance
$34,090
Interest Rate
6.82%
Mortgage Type
Stand Alone First
Estimated Equity
$165,234
Purchase Details
Closed on
Apr 19, 1995
Sold by
Mcleroy Charles Henry and Mcleroy Charles Henry
Bought by
Trujillo Mario and Trujillo Cynthia
Home Financials for this Owner
Home Financials are based on the most recent Mortgage that was taken out on this home.
Original Mortgage
$55,322
Interest Rate
8.53%
Create a Home Valuation Report for This Property
The Home Valuation Report is an in-depth analysis detailing your home's value as well as a comparison with similar homes in the area
Home Values in the Area
Average Home Value in this Area
Purchase History
| Date | Buyer | Sale Price | Title Company |
|---|---|---|---|
| Leija Brisa | -- | First American Title | |
| Trujillo Mario | -- | First American Title |
Source: Public Records
Mortgage History
| Date | Status | Borrower | Loan Amount |
|---|---|---|---|
| Open | Leija Brisa | $80,569 | |
| Previous Owner | Trujillo Mario | $55,322 | |
| Closed | Trujillo Mario | $3,000 |
Source: Public Records
Tax History
| Year | Tax Paid | Tax Assessment Tax Assessment Total Assessment is a certain percentage of the fair market value that is determined by local assessors to be the total taxable value of land and additions on the property. | Land | Improvement |
|---|---|---|---|---|
| 2025 | $1,899 | $191,980 | $55,294 | $136,686 |
| 2024 | $1,899 | $201,589 | $55,294 | $146,295 |
| 2023 | $1,899 | $204,101 | $55,294 | $148,807 |
| 2022 | $3,778 | $176,659 | $55,591 | $121,068 |
| 2021 | $3,640 | $132,290 | $19,297 | $112,993 |
| 2020 | $3,514 | $126,194 | $19,297 | $106,897 |
| 2019 | $3,293 | $124,654 | $19,297 | $105,357 |
| 2018 | $2,057 | $112,984 | $19,297 | $93,687 |
| 2017 | $2,660 | $112,984 | $19,297 | $93,687 |
| 2016 | $2,418 | $103,006 | $19,297 | $83,709 |
| 2015 | $1,690 | $92,012 | $19,297 | $72,715 |
| 2014 | $1,690 | $75,108 | $19,297 | $55,811 |
Source: Public Records
Map
Nearby Homes
- 4707 Glendower Dr
- 4922 Glendower Dr
- 23122 Summergate Dr
- 22823 W Fairfax Village Cir
- 5023 Glendower Dr
- 4606 Fitzwater Dr
- 5027 Monteith Dr
- 4822 S Fairfax Village Cir
- 23202 Summergate Dr
- 5031 Monteith Dr
- 23206 Goodfellow Dr
- 5002 Maurita Dr
- 4551 Algernon Dr
- 5402 Sherrylee Ln
- 23122 Cimber Ln
- 5311 Oaklynn Dr
- 5414 Honeybear Ln
- 4314 Wyanngate Dr
- 4527 Adonis Dr
- 23022 Laketree Ln
- 4734 Glendower Dr
- 4806 Glendower Dr
- 4730 Glendower Dr
- 4810 Glendower Dr
- 4735 Glendower Dr
- 4726 Glendower Dr
- 4814 Glendower Dr
- 4731 Glendower Dr
- 4722 Glendower Dr
- 4815 Glendower Dr
- 4818 Glendower Dr
- 4727 Glendower Dr
- 23046 Banquo Dr
- 23042 Banquo Dr
- 23050 Banquo Dr
- 4718 Glendower Dr
- 23038 Banquo Dr
- 4806 Fitzwater Dr
- 4822 Glendower Dr
- 4723 Glendower Dr
Your Personal Tour Guide
Ask me questions while you tour the home.