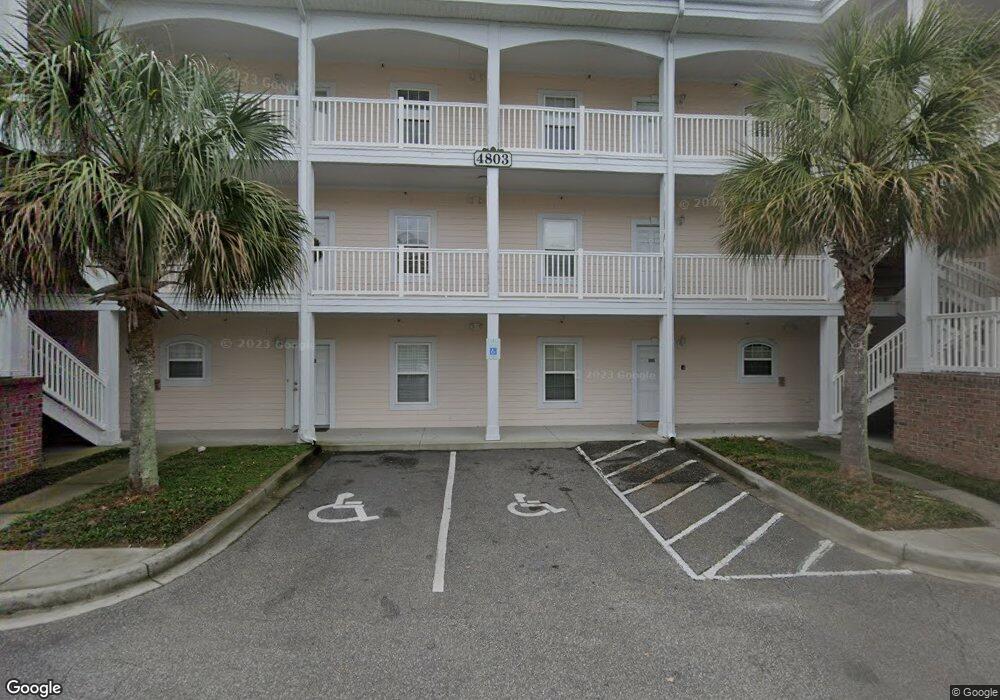
4803 Bovardia Place Unit 4102 Myrtle Beach, SC 29577
Myrtlewood NeighborhoodEstimated Value: $228,000 - $238,000
2
Beds
2
Baths
1,070
Sq Ft
$216/Sq Ft
Est. Value
About This Home
This home is located at 4803 Bovardia Place Unit 4102, Myrtle Beach, SC 29577 and is currently estimated at $231,594, approximately $216 per square foot. 4803 Bovardia Place Unit 4102 is a home located in Horry County with nearby schools including Myrtle Beach Child Development Center, Myrtle Beach Elementary School, and Myrtle Beach Primary School.
Ownership History
Date
Name
Owned For
Owner Type
Purchase Details
Closed on
Jun 9, 2025
Sold by
Garst Charles J
Bought by
Spagnolo Nicholas
Current Estimated Value
Home Financials for this Owner
Home Financials are based on the most recent Mortgage that was taken out on this home.
Original Mortgage
$174,420
Outstanding Balance
$173,968
Interest Rate
6.76%
Mortgage Type
New Conventional
Estimated Equity
$57,626
Purchase Details
Closed on
Jun 19, 2020
Sold by
Mullins Andrew J
Bought by
Garst Charles J
Home Financials for this Owner
Home Financials are based on the most recent Mortgage that was taken out on this home.
Original Mortgage
$114,600
Interest Rate
3.2%
Mortgage Type
New Conventional
Purchase Details
Closed on
Mar 11, 2015
Sold by
Noble Investments Inc
Bought by
Shane Joseph and Shane Laurie
Purchase Details
Closed on
Nov 25, 2014
Sold by
Tesema Yonas and Tesema Genet
Bought by
Noble Investments Inc
Purchase Details
Closed on
Mar 18, 2013
Sold by
Master In Equity Horry County
Bought by
Magnolia Place East Home Owners Associat
Purchase Details
Closed on
Sep 6, 2006
Sold by
Apex Homes Inc
Bought by
Tesema Yonas and Tesema Genet
Create a Home Valuation Report for This Property
The Home Valuation Report is an in-depth analysis detailing your home's value as well as a comparison with similar homes in the area
Home Values in the Area
Average Home Value in this Area
Purchase History
| Date | Buyer | Sale Price | Title Company |
|---|---|---|---|
| Spagnolo Nicholas | $228,000 | -- | |
| Garst Charles J | $143,250 | -- | |
| Shane Joseph | $95,000 | -- | |
| Noble Investments Inc | $61,000 | -- | |
| Magnolia Place East Home Owners Associat | $10,000 | -- | |
| Tesema Yonas | $119,900 | None Available |
Source: Public Records
Mortgage History
| Date | Status | Borrower | Loan Amount |
|---|---|---|---|
| Open | Spagnolo Nicholas | $174,420 | |
| Previous Owner | Garst Charles J | $114,600 |
Source: Public Records
Tax History Compared to Growth
Tax History
| Year | Tax Paid | Tax Assessment Tax Assessment Total Assessment is a certain percentage of the fair market value that is determined by local assessors to be the total taxable value of land and additions on the property. | Land | Improvement |
|---|---|---|---|---|
| 2024 | $2,057 | $14,994 | $0 | $14,994 |
| 2023 | $2,057 | $14,900 | $0 | $14,900 |
| 2021 | $1,899 | $14,900 | $0 | $14,900 |
| 2020 | $1,337 | $11,025 | $0 | $11,025 |
| 2019 | $1,337 | $11,025 | $0 | $11,025 |
| 2018 | $0 | $9,975 | $0 | $9,975 |
| 2017 | -- | $5,700 | $0 | $5,700 |
| 2016 | -- | $5,700 | $0 | $5,700 |
| 2015 | $1,280 | $3,920 | $0 | $3,920 |
| 2014 | $1,238 | $5,880 | $0 | $5,880 |
Source: Public Records
Map
Nearby Homes
- 4803 Bovardia Place Unit 104
- 4872 Dahlia Ct Unit 103
- 4872 Dahlia Ct Unit 301
- 4870 Dahlia Ct Unit 304
- 4864 Carnation Cir Unit 304
- 4893 Magnolia Pointe Ln Unit 304
- 4893 Magnolia Pointe Ln Unit 305
- 4877 Magnolia Pointe Ln Unit 201
- 4860 Carnation Cir Unit 203
- 4860 Carnation Cir Unit 302
- 4860 Carnation Cir Unit 304
- 4827 Orchid Way Unit 201
- 4827 Orchid Way Unit 105
- 4885 Magnolia Pointe Ln Unit 304
- 4823 Orchid Way Unit 102
- 4823 Orchid Way Unit 2203
- 4846 Carnation Cir Unit 13-102
- 4846 Carnation Cir Unit 103
- 4846 Carnation Cir Unit 203
- 4839 Carnation Cir Unit 303
- 4803 Bovardia Place Unit 303
- 4803 Bovardia Place Unit 301
- 4803 Bovardia Place Unit 302
- 4803 Bovardia Place Unit 304 Magnolia Place
- 4803 Bovardia Place
- 4803 Bovardia Place Unit 101
- 4803 Bovardia Place Unit 4101
- 4803 Bovardia Place Unit 4304
- 4803 Bovardia Place Unit 4303
- 4803 Bovardia Place Unit 4302
- 4803 Bovardia Place Unit 4301
- 4803 Bovardia Place Unit 4204
- 4803 Bovardia Place Unit 4203
- 4803 Bovardia Place Unit 4202
- 4803 Bovardia Place Unit 4201
- 4803 Bovardia Place Unit 4104
- 4803 Bovardia Place Unit 4103
- 4803 Bouvardia Place Unit 102
- 4803 Bouvardia Place Unit 201
- 4803 Bouvardia Place Unit 103