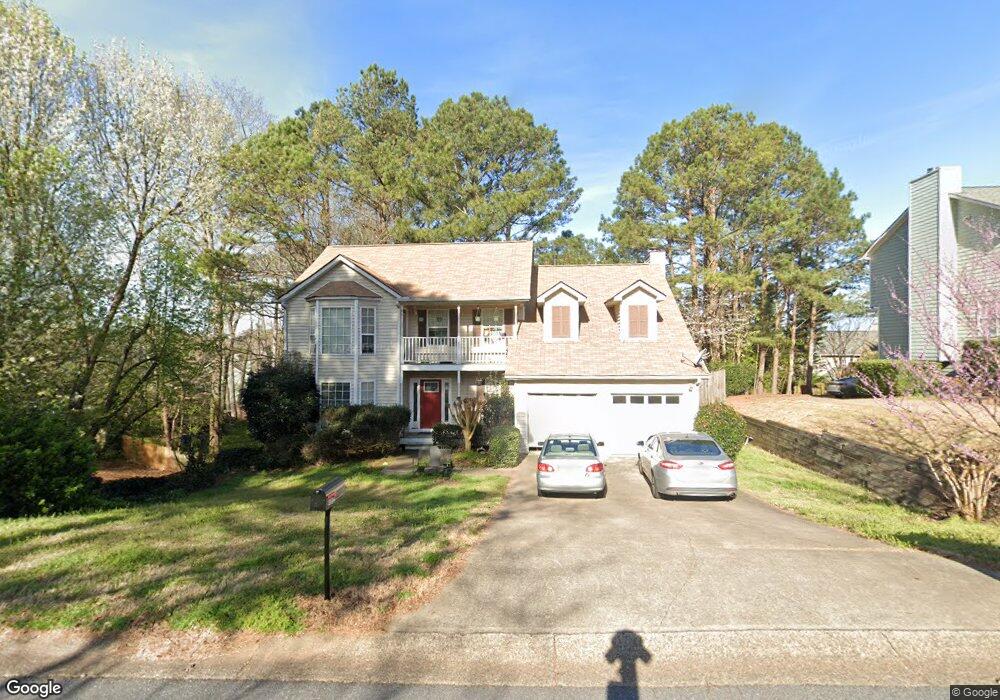
4803 Old Field Dr NE Unit 2 Kennesaw, GA 30144
Estimated Value: $406,386 - $443,000
4
Beds
3
Baths
2,404
Sq Ft
$174/Sq Ft
Est. Value
About This Home
This home is located at 4803 Old Field Dr NE Unit 2, Kennesaw, GA 30144 and is currently estimated at $419,347, approximately $174 per square foot. 4803 Old Field Dr NE Unit 2 is a home located in Cobb County with nearby schools including Blackwell Elementary School, McCleskey Middle School, and Kell High School.
Ownership History
Date
Name
Owned For
Owner Type
Purchase Details
Closed on
Aug 6, 2004
Sold by
Arrington Carman S and Arrington James D
Bought by
Price Joseph K and Price Caryn
Current Estimated Value
Home Financials for this Owner
Home Financials are based on the most recent Mortgage that was taken out on this home.
Original Mortgage
$142,400
Outstanding Balance
$66,012
Interest Rate
5.13%
Mortgage Type
New Conventional
Estimated Equity
$353,335
Purchase Details
Closed on
Apr 5, 2002
Sold by
Redmon Carman S
Bought by
Arrington Carman S and Arrington James D
Home Financials for this Owner
Home Financials are based on the most recent Mortgage that was taken out on this home.
Original Mortgage
$122,400
Interest Rate
7.07%
Mortgage Type
New Conventional
Purchase Details
Closed on
Jan 5, 1995
Sold by
Diversified Shelter Group
Bought by
Redmon Carman S
Home Financials for this Owner
Home Financials are based on the most recent Mortgage that was taken out on this home.
Original Mortgage
$97,100
Interest Rate
9.24%
Create a Home Valuation Report for This Property
The Home Valuation Report is an in-depth analysis detailing your home's value as well as a comparison with similar homes in the area
Home Values in the Area
Average Home Value in this Area
Purchase History
| Date | Buyer | Sale Price | Title Company |
|---|---|---|---|
| Price Joseph K | $178,000 | -- | |
| Arrington Carman S | -- | -- | |
| Redmon Carman S | $121,400 | -- |
Source: Public Records
Mortgage History
| Date | Status | Borrower | Loan Amount |
|---|---|---|---|
| Open | Price Joseph K | $142,400 | |
| Previous Owner | Arrington Carman S | $122,400 | |
| Previous Owner | Redmon Carman S | $97,100 |
Source: Public Records
Tax History Compared to Growth
Tax History
| Year | Tax Paid | Tax Assessment Tax Assessment Total Assessment is a certain percentage of the fair market value that is determined by local assessors to be the total taxable value of land and additions on the property. | Land | Improvement |
|---|---|---|---|---|
| 2025 | $4,160 | $179,440 | $34,000 | $145,440 |
| 2024 | $4,163 | $179,440 | $34,000 | $145,440 |
| 2023 | $2,878 | $145,232 | $34,000 | $111,232 |
| 2022 | $3,305 | $138,680 | $20,000 | $118,680 |
| 2021 | $2,685 | $110,356 | $20,000 | $90,356 |
| 2020 | $2,445 | $99,404 | $20,000 | $79,404 |
| 2019 | $2,293 | $92,468 | $20,000 | $72,468 |
| 2018 | $2,293 | $92,468 | $20,000 | $72,468 |
| 2017 | $1,901 | $78,408 | $12,000 | $66,408 |
| 2016 | $1,904 | $78,408 | $12,000 | $66,408 |
| 2015 | $1,715 | $67,992 | $12,000 | $55,992 |
| 2014 | $1,729 | $67,992 | $0 | $0 |
Source: Public Records
Map
Nearby Homes
- 4926 Shallow Ridge Rd NE
- 1816 Yorkshire Dr
- 30 Shallowford Rd NE
- 2108 Yorkshire Ct
- 5096 Shalloway Ct NE Unit 1
- 163 Castleair Ct NE
- 1502 Lake Koinonia Dr
- 4978 Thornwood Cove NW
- 0 Lake Latimer Dr NE Unit 7564947
- 48 Lake Latimer Dr NE
- 46 Lake Latimer Dr NE
- 44 Lake Latimer Dr NE
- 0 Lake Latimer Dr NE Unit 10506857
- 4961 Thornwood Trace NW
- 0 Watkins Glen Dr NE Unit 7564156
- 0 Watkins Glen Dr NE Unit 10506865
- 414 Delancy Dr
- 221 Ellis Ln
- 150 Holden Way
- 101 Holden Way
- 4805 Old Field Dr NE
- 5011 Old Field Ct NE
- 4933 Shallow Ridge Rd NE
- 4931 Shallow Ridge Rd NE
- 4807 Old Field Dr NE
- 4802 Old Field Dr NE Unit 2
- 5009 Old Field Ct NE
- 4804 Old Field Dr NE
- 4939 Shallow Ridge Rd NE
- 4929 Shallow Ridge Rd NE Unit Ga0031
- 4929 Shallow Ridge Rd NE
- 4929 Shallow Ridge Rd NE Unit GA00310
- 4929 Shallow Ridge Rd NE Unit Ga0031
- 4806 Old Field Dr NE
- 5010 Old Field Ct NE Unit 2
- 4809 Old Field Dr NE
- 4927 Shallow Ridge Rd NE
- 4808 Old Field Dr NE
- 4934 Shallow Ridge Rd NE
- 5007 Old Field Ct NE