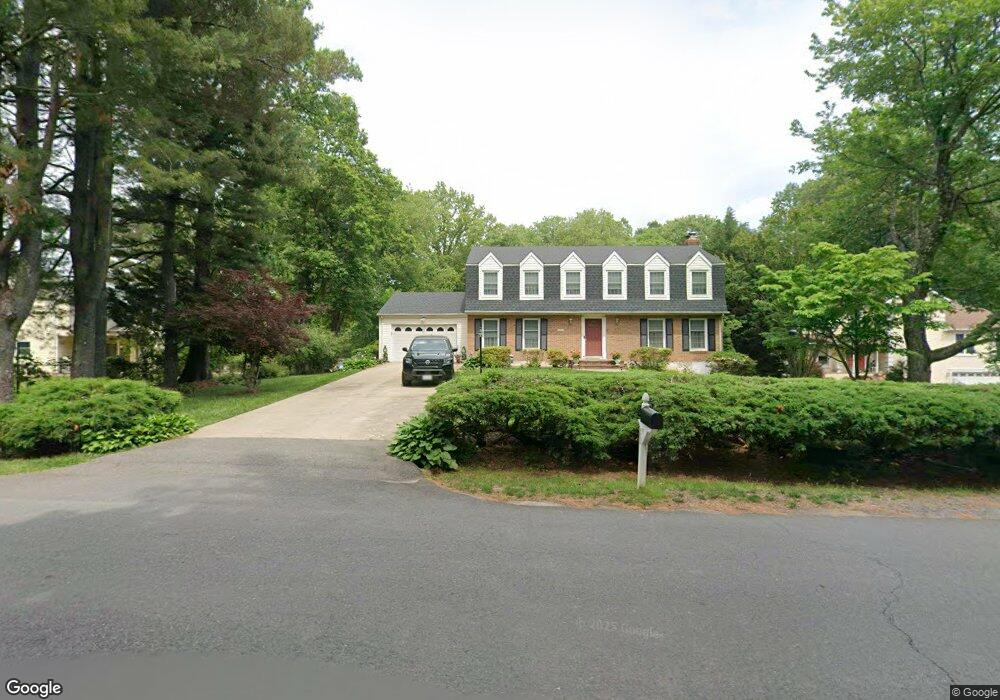
4803 Piney Branch Rd Fairfax, VA 22030
Estimated Value: $917,263 - $1,056,000
4
Beds
3
Baths
2,376
Sq Ft
$406/Sq Ft
Est. Value
About This Home
This home is located at 4803 Piney Branch Rd, Fairfax, VA 22030 and is currently estimated at $965,566, approximately $406 per square foot. 4803 Piney Branch Rd is a home located in Fairfax County with nearby schools including Willow Springs Elementary School, Johnson Middle School, and Fairfax High.
Ownership History
Date
Name
Owned For
Owner Type
Purchase Details
Closed on
Sep 25, 1979
Bought by
Roy Carl B and And Mary L
Current Estimated Value
Create a Home Valuation Report for This Property
The Home Valuation Report is an in-depth analysis detailing your home's value as well as a comparison with similar homes in the area
Home Values in the Area
Average Home Value in this Area
Purchase History
| Date | Buyer | Sale Price | Title Company |
|---|---|---|---|
| Roy Carl B | $100,700 | -- |
Source: Public Records
Tax History Compared to Growth
Tax History
| Year | Tax Paid | Tax Assessment Tax Assessment Total Assessment is a certain percentage of the fair market value that is determined by local assessors to be the total taxable value of land and additions on the property. | Land | Improvement |
|---|---|---|---|---|
| 2025 | $8,956 | $812,780 | $356,000 | $456,780 |
| 2024 | $8,956 | $773,090 | $346,000 | $427,090 |
| 2023 | $7,991 | $708,140 | $346,000 | $362,140 |
| 2022 | $7,863 | $687,590 | $336,000 | $351,590 |
| 2021 | $7,761 | $661,350 | $321,000 | $340,350 |
| 2020 | $6,956 | $587,710 | $311,000 | $276,710 |
| 2019 | $6,630 | $560,210 | $304,000 | $256,210 |
| 2018 | $6,442 | $560,210 | $304,000 | $256,210 |
| 2017 | $6,504 | $560,210 | $304,000 | $256,210 |
| 2016 | $6,299 | $543,750 | $295,000 | $248,750 |
| 2015 | $6,068 | $543,750 | $295,000 | $248,750 |
| 2014 | $5,767 | $517,900 | $281,000 | $236,900 |
Source: Public Records
Map
Nearby Homes
- 4683 Eggleston Terrace Unit 232
- 4656 Battenburg Ln Unit 522
- 4656 Battenburg Ln
- 4703 Marymead Dr
- 4634 Battenburg Ln Unit 631
- 4628 Battenburg Ln
- 4579 Whittemore Place Unit 1242
- 5020 Pheasant Ridge Rd
- 12045 Overbridge Ln
- 12006 Ashford Green Dr
- 12148 Garden Grove Cir Unit 403
- 12120 Garden Ridge Ln Unit 401
- 4401 Weatherington Ln Unit 401
- 12582 Birkdale Way
- 12315 Yellow Buckeye Way
- 5250 Winfield Rd
- 4824 Village Dr
- 5300 Winfield Rd
- 4479B Beacon Grove Cir
- 5360 Winfield Rd
- 4805 Piney Branch Rd
- 12219 Lee Hwy
- 12217 Lee Hwy
- 4807 Piney Branch Rd
- 12221 Lee Hwy
- 4802 Piney Branch Rd
- 4809 Piney Branch Rd
- 4806 Piney Branch Rd
- 12223 Lee Hwy
- 4808 Piney Branch Rd
- 4804 Piney Branch Rd
- 4810 Piney Branch Rd
- 4775 Piney Branch Rd
- 12225 Lee Hwy
- 4819 Piney Branch Rd
- 4818 Piney Branch Rd
- 12101 Route 29
- 12193 Camborne Terrace
- 12195 Camborne Terrace
- 12197 Camborne Terrace