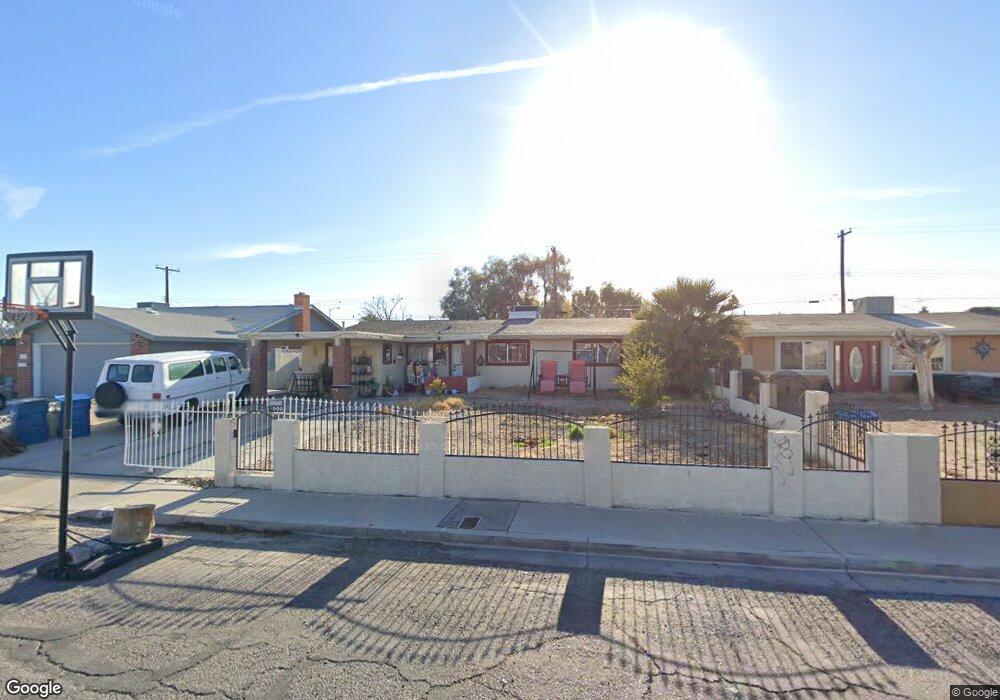
4803 Tamalpias Ave Las Vegas, NV 89120
Paradise Valley East NeighborhoodEstimated Value: $322,998 - $353,000
3
Beds
2
Baths
1,288
Sq Ft
$264/Sq Ft
Est. Value
About This Home
This home is located at 4803 Tamalpias Ave, Las Vegas, NV 89120 and is currently estimated at $340,000, approximately $263 per square foot. 4803 Tamalpias Ave is a home located in Clark County with nearby schools including Harley Harmon Elementary School, Francis H Cortney Junior High School, and Del Sol Academy of the Performing Arts.
Ownership History
Date
Name
Owned For
Owner Type
Purchase Details
Closed on
Sep 12, 2005
Sold by
Estala Jose Mario and Estala Virginia Nunez
Bought by
Estala Jose M and Estala Virginia N
Current Estimated Value
Home Financials for this Owner
Home Financials are based on the most recent Mortgage that was taken out on this home.
Original Mortgage
$176,400
Outstanding Balance
$95,970
Interest Rate
6.12%
Mortgage Type
New Conventional
Estimated Equity
$244,030
Purchase Details
Closed on
Apr 17, 2002
Sold by
Torres Maria A and Ayala Maria Hortencia
Bought by
Estala Jose Mario and Estala Virginia Nunez
Home Financials for this Owner
Home Financials are based on the most recent Mortgage that was taken out on this home.
Original Mortgage
$122,802
Interest Rate
6.87%
Mortgage Type
FHA
Purchase Details
Closed on
Mar 19, 2001
Sold by
Torres Raul
Bought by
Torres Maria
Purchase Details
Closed on
Jun 2, 1995
Sold by
Lara Orlando
Bought by
Torres Raul O and Torres Maria A
Home Financials for this Owner
Home Financials are based on the most recent Mortgage that was taken out on this home.
Original Mortgage
$81,800
Interest Rate
8.32%
Mortgage Type
FHA
Create a Home Valuation Report for This Property
The Home Valuation Report is an in-depth analysis detailing your home's value as well as a comparison with similar homes in the area
Home Values in the Area
Average Home Value in this Area
Purchase History
| Date | Buyer | Sale Price | Title Company |
|---|---|---|---|
| Estala Jose M | -- | Fidelity National Title | |
| Estala Jose Mario | $123,900 | United Title | |
| Torres Maria | -- | -- | |
| Torres Raul O | $82,000 | Land Title |
Source: Public Records
Mortgage History
| Date | Status | Borrower | Loan Amount |
|---|---|---|---|
| Open | Estala Jose M | $176,400 | |
| Closed | Estala Jose Mario | $122,802 | |
| Previous Owner | Torres Raul O | $81,800 |
Source: Public Records
Tax History Compared to Growth
Tax History
| Year | Tax Paid | Tax Assessment Tax Assessment Total Assessment is a certain percentage of the fair market value that is determined by local assessors to be the total taxable value of land and additions on the property. | Land | Improvement |
|---|---|---|---|---|
| 2025 | $509 | $41,609 | $24,850 | $16,759 |
| 2024 | $495 | $41,609 | $24,850 | $16,759 |
| 2023 | $495 | $45,558 | $30,450 | $15,108 |
| 2022 | $527 | $37,311 | $23,800 | $13,511 |
| 2021 | $488 | $35,334 | $22,750 | $12,584 |
| 2020 | $450 | $32,528 | $20,300 | $12,228 |
| 2019 | $422 | $29,315 | $17,500 | $11,815 |
| 2018 | $403 | $26,450 | $15,400 | $11,050 |
| 2017 | $701 | $23,896 | $12,950 | $10,946 |
| 2016 | $378 | $19,393 | $8,750 | $10,643 |
| 2015 | $376 | $16,310 | $6,300 | $10,010 |
| 2014 | $364 | $13,998 | $5,250 | $8,748 |
Source: Public Records
Map
Nearby Homes
- 4805 Terra Linda Ave
- 4715 Mill Valley Dr
- 4676 Tamalpias Ave
- 4647 Mill Valley Dr
- 5086 Mountain Vista St
- 5022 Carmel Ave Unit 3
- 4674 Petaluma Cir
- 4945 Rita Dr
- 4944 Rita Dr
- 4727 Conrad St
- 4845 S Mountain Vista St
- 5122 Gregg Place
- 4716 Bennett Dr
- 4655 Bennett Dr
- 5077 Myrtlewood Ave
- 5063 Blanton Dr
- 5030 E Hacienda Ave
- 4999 Nellis Cir
- 5068 Killarney St
- 5142 Morris St
- 4809 Tamalpias Ave
- 4797 Tamalpias Ave
- 4828 San Rafael Ave
- 4822 San Rafael Ave
- 4815 Tamalpias Ave
- 4791 Tamalpias Ave
- 4834 San Rafael Ave
- 4816 San Rafael Ave
- 4802 Tamalpias Ave
- 4840 San Rafael Ave Unit 1
- 4821 Tamalpias Ave
- 4821 Tamalpias Ave Unit na
- 4785 Tamalpias Ave
- 4810 San Rafael Ave
- 4810 Tamalpias Ave
- 5025 Pleasanton Cir Unit 1
- 4846 San Rafael Ave
- 4827 Tamalpias Ave
- 4804 San Rafael Ave
- 4816 Tamalpias Ave