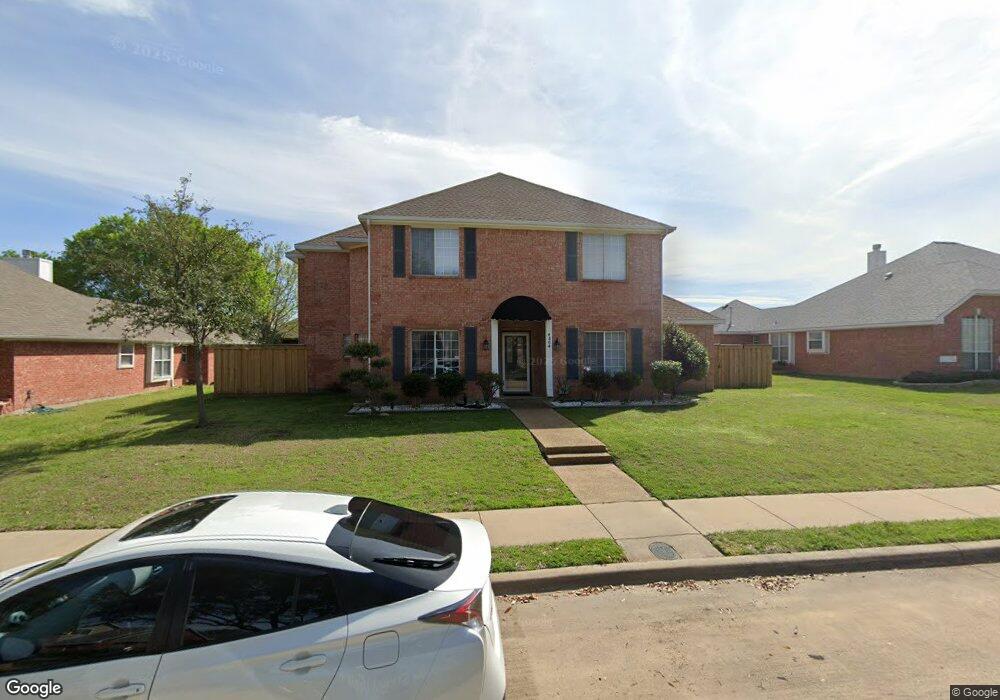
4804 Maple Shade Ave Sachse, TX 75048
Estimated Value: $404,018 - $452,000
4
Beds
3
Baths
2,363
Sq Ft
$182/Sq Ft
Est. Value
About This Home
This home is located at 4804 Maple Shade Ave, Sachse, TX 75048 and is currently estimated at $430,505, approximately $182 per square foot. 4804 Maple Shade Ave is a home located in Dallas County with nearby schools including Harmony Science Academy - Garland, Harmony School of Innovation - Garland, and Pinnacle Montessori of Sachse.
Ownership History
Date
Name
Owned For
Owner Type
Purchase Details
Closed on
Feb 7, 2018
Sold by
Mayes Michael J and Mayes Jonna C
Bought by
Chounramany Phuong Tam Dinh and Chounramany Tony
Current Estimated Value
Home Financials for this Owner
Home Financials are based on the most recent Mortgage that was taken out on this home.
Original Mortgage
$248,076
Outstanding Balance
$158,933
Interest Rate
3.99%
Mortgage Type
Purchase Money Mortgage
Estimated Equity
$271,572
Purchase Details
Closed on
Nov 16, 1998
Sold by
Dewsan Investments Ltd
Bought by
Mayes Michael J and Mayes Jonna C
Home Financials for this Owner
Home Financials are based on the most recent Mortgage that was taken out on this home.
Original Mortgage
$88,900
Interest Rate
6.9%
Purchase Details
Closed on
Feb 10, 1998
Sold by
Thedford Billy R
Bought by
Dewsan Investments Ltd
Create a Home Valuation Report for This Property
The Home Valuation Report is an in-depth analysis detailing your home's value as well as a comparison with similar homes in the area
Home Values in the Area
Average Home Value in this Area
Purchase History
| Date | Buyer | Sale Price | Title Company |
|---|---|---|---|
| Chounramany Phuong Tam Dinh | -- | None Available | |
| Mayes Michael J | -- | -- | |
| Dewsan Investments Ltd | -- | -- |
Source: Public Records
Mortgage History
| Date | Status | Borrower | Loan Amount |
|---|---|---|---|
| Open | Chounramany Phuong Tam Dinh | $248,076 | |
| Previous Owner | Mayes Michael J | $88,900 |
Source: Public Records
Tax History Compared to Growth
Tax History
| Year | Tax Paid | Tax Assessment Tax Assessment Total Assessment is a certain percentage of the fair market value that is determined by local assessors to be the total taxable value of land and additions on the property. | Land | Improvement |
|---|---|---|---|---|
| 2025 | $9,201 | $411,780 | $80,000 | $331,780 |
| 2024 | $9,201 | $411,780 | $80,000 | $331,780 |
| 2023 | $9,201 | $411,780 | $80,000 | $331,780 |
| 2022 | $8,197 | $342,590 | $50,000 | $292,590 |
| 2021 | $6,940 | $269,670 | $36,000 | $233,670 |
| 2020 | $7,055 | $269,670 | $36,000 | $233,670 |
| 2019 | $7,014 | $247,270 | $36,000 | $211,270 |
| 2018 | $7,082 | $247,270 | $36,000 | $211,270 |
| 2017 | $5,559 | $193,550 | $36,000 | $157,550 |
| 2016 | $5,559 | $193,550 | $36,000 | $157,550 |
| 2015 | $3,528 | $185,450 | $27,000 | $158,450 |
| 2014 | $3,528 | $145,440 | $27,000 | $118,440 |
Source: Public Records
Map
Nearby Homes
- 4609 Hunters Ridge Dr
- 4404 Coldbrook Ln
- 4819 Jackson Meadows Dr
- 4133 Lone Elm St
- 5115 Willow Bend Ln
- 5207 Seth Ave
- 5159 Willow Bend Ln
- 3731 Frost St
- 5111 Live Oak Dr
- 3821 Red Oak St
- 4812 Riverbirch Dr
- 4505 Merritt Rd
- 3610 Pacific Way
- 3602 Pacific Way
- 4008 Leigh Ct
- 3403 Scotsman Rd
- 3505 Central Blvd
- 5306 Waterloo Dr
- 5426 Depot Dr
- 3322 Scotsman Rd
- 4808 Maple Shade Ave
- 4800 Maple Shade Ave
- 4721 Rustic Ridge Ct
- 4812 Maple Shade Ave
- 4712 Maple Shade Ave
- 4803 Maple Shade Ave
- 4807 Rustic Ridge Ct
- 4801 Maple Shade Ave
- 4807 Maple Shade Ave
- 4715 Rustic Ridge Ct
- 4811 Rustic Ridge Ct
- 4709 Maple Shade Ave
- 4811 Maple Shade Ave
- 4900 Maple Shade Ave
- 4708 Maple Shade Ave
- 4709 Rustic Ridge Ct
- 4707 Maple Shade Ave
- 4628 Harvest Ln
- 4901 Maple Shade Ave
- 4815 Rustic Ridge Ct