
Landlord's Agent in 2025
Xianli Wang
First Choice Homes Realty, LLC
(770) 380-9307
3 in this area
36 Total Sales
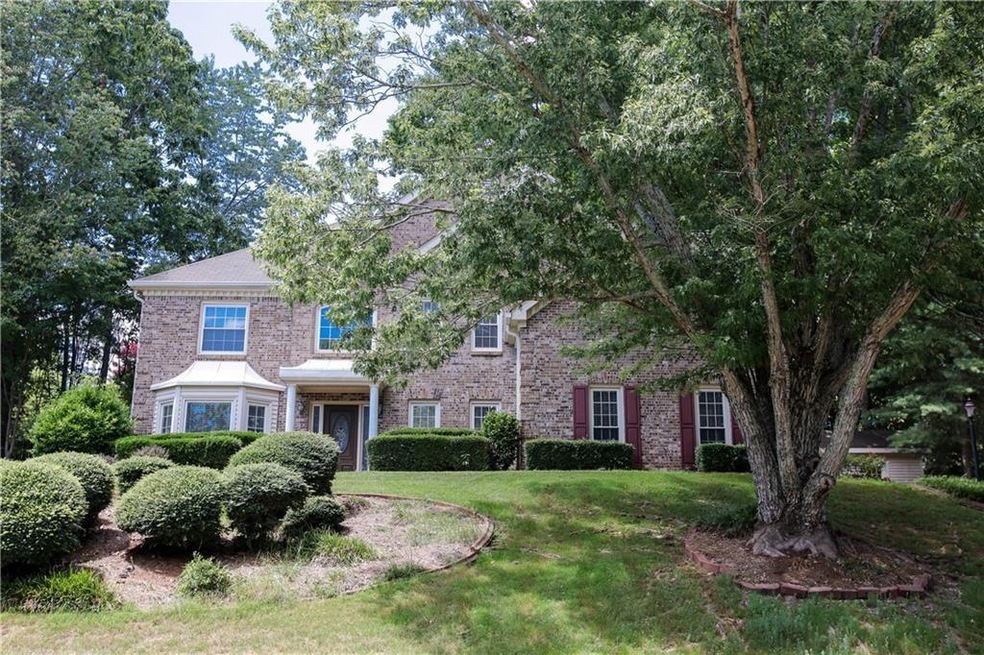
Fantastic home located in sought-after Aberdeen! Brick front, open floor plan, oversized master with large walk-in closet. New painting of the whole house, close to shopping and great restaurants. Top-rated school district. Deep cleaned and ready to move in.
Last Agent to Rent the Property
First Choice Homes Realty, LLC License #357645 Listed on: 01/15/2025
| Date | Event | Price | Change | Sq Ft Price |
|---|---|---|---|---|
| 02/26/2025 02/26/25 | Rented | $2,500 | 0.0% | -- |
| 02/15/2025 02/15/25 | Under Contract | -- | -- | -- |
| 01/15/2025 01/15/25 | For Rent | $2,500 | +8.7% | -- |
| 09/01/2022 09/01/22 | Rented | $2,300 | 0.0% | -- |
| 08/01/2022 08/01/22 | Under Contract | -- | -- | -- |
| 07/18/2022 07/18/22 | For Rent | $2,300 | +27.8% | -- |
| 05/18/2020 05/18/20 | Rented | $1,800 | 0.0% | -- |
| 04/27/2020 04/27/20 | Price Changed | $1,800 | -5.3% | $1 / Sq Ft |
| 04/23/2020 04/23/20 | For Rent | $1,900 | +18.8% | -- |
| 03/12/2018 03/12/18 | Rented | $1,600 | 0.0% | -- |
| 02/14/2018 02/14/18 | For Rent | $1,600 | 0.0% | -- |
| 02/08/2016 02/08/16 | Sold | $246,500 | -3.3% | $99 / Sq Ft |
| 01/22/2016 01/22/16 | Pending | -- | -- | -- |
| 12/19/2015 12/19/15 | For Sale | $254,900 | 0.0% | $103 / Sq Ft |
| 11/12/2015 11/12/15 | Pending | -- | -- | -- |
| 10/31/2015 10/31/15 | For Sale | $254,900 | -- | $103 / Sq Ft |
| Year | Tax Paid | Tax Assessment Tax Assessment Total Assessment is a certain percentage of the fair market value that is determined by local assessors to be the total taxable value of land and additions on the property. | Land | Improvement |
|---|---|---|---|---|
| 2025 | $5,196 | $210,332 | $78,000 | $132,332 |
| 2024 | $5,196 | $211,900 | $68,000 | $143,900 |
| 2023 | $5,018 | $203,868 | $60,000 | $143,868 |
| 2022 | $4,001 | $137,264 | $40,000 | $97,264 |
| 2021 | $3,790 | $137,264 | $40,000 | $97,264 |
| 2020 | $3,674 | $133,048 | $40,000 | $93,048 |
| 2019 | $3,448 | $124,676 | $40,000 | $84,676 |
| 2018 | $3,049 | $110,260 | $30,000 | $80,260 |
| 2017 | $2,633 | $94,856 | $30,000 | $64,856 |
| 2016 | $2,529 | $94,856 | $30,000 | $64,856 |
| 2015 | $2,293 | $92,644 | $26,000 | $59,616 |
| 2014 | $2,061 | $81,128 | $0 | $0 |
Landlord's Agent in 2025
Xianli Wang
First Choice Homes Realty, LLC
(770) 380-9307
3 in this area
36 Total Sales
Tenant's Agent in 2025
Erdal Akbas
Chapman Hall Realtors
(678) 438-2532
5 in this area
204 Total Sales
Buyer's Agent in 2022
Jinal Patel
Virtual Properties Realty.BIZ
(770) 568-0747
1 in this area
4 Total Sales
Seller's Agent in 2020
Jack Bai
Virtual Properties Realty
(678) 310-5888
9 in this area
41 Total Sales
N
Buyer's Agent in 2020
NON-MLS NMLS
Non FMLS Member
T
Seller Co-Listing Agent in 2018
Teresa Willis
Keller Williams Realty Atlanta Partners
(404) 431-4104
2 in this area
13 Total Sales
Source: First Multiple Listing Service (FMLS)
MLS Number: 7509317
APN: 160-006
Disclaimer: Certain information contained herein is derived from information provided by parties other than Homes.com. All information provided is deemed reliable, but is not guaranteed to be accurate and should be independently verified.
![]() Listings identified with the FMLS IDX logo come from FMLS and are held by brokerage firms other than the owner of this website. The listing brokerage is identified in any listing details. Information is deemed reliable but is not guaranteed. If you believe any FMLS listing contains material that infringes your copyrighted work please visit www.fmls.com/dmca to review our DMCA policy and learn how to submit a takedown request. © 2025 First Multiple Listing Service, Inc.
Listings identified with the FMLS IDX logo come from FMLS and are held by brokerage firms other than the owner of this website. The listing brokerage is identified in any listing details. Information is deemed reliable but is not guaranteed. If you believe any FMLS listing contains material that infringes your copyrighted work please visit www.fmls.com/dmca to review our DMCA policy and learn how to submit a takedown request. © 2025 First Multiple Listing Service, Inc.