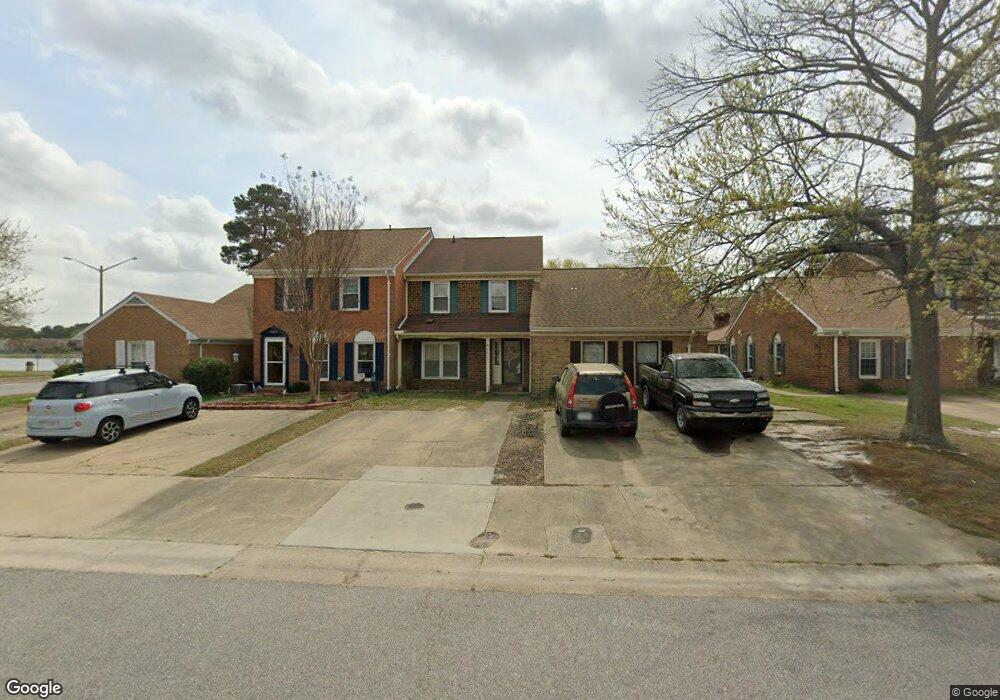
4805 Deming Ct Virginia Beach, VA 23462
Kempsville Lake NeighborhoodEstimated Value: $217,000 - $301,000
2
Beds
3
Baths
1,330
Sq Ft
$207/Sq Ft
Est. Value
About This Home
This home is located at 4805 Deming Ct, Virginia Beach, VA 23462 and is currently estimated at $275,948, approximately $207 per square foot. 4805 Deming Ct is a home located in Virginia Beach City with nearby schools including Kempsville Elementary School, Larkspur Middle School, and Kempsville High School.
Ownership History
Date
Name
Owned For
Owner Type
Purchase Details
Closed on
Feb 13, 2019
Sold by
The Secretary Of Hud
Bought by
Lin Qi
Current Estimated Value
Home Financials for this Owner
Home Financials are based on the most recent Mortgage that was taken out on this home.
Original Mortgage
$98,400
Outstanding Balance
$86,335
Interest Rate
4.4%
Mortgage Type
New Conventional
Estimated Equity
$188,635
Purchase Details
Closed on
May 24, 2018
Sold by
Ocwen Loan Servicing Llc
Bought by
Secretary Of Hud
Purchase Details
Closed on
May 3, 2018
Sold by
Equity Trustees Llc A Virginia Limited L
Bought by
Ocwen Loan Servicing Llc
Purchase Details
Closed on
Dec 28, 2007
Sold by
Mulligan Kevin
Bought by
Rodgers Jorvas
Home Financials for this Owner
Home Financials are based on the most recent Mortgage that was taken out on this home.
Original Mortgage
$191,987
Interest Rate
6.27%
Mortgage Type
FHA
Purchase Details
Closed on
Dec 18, 2004
Sold by
Sims George L
Bought by
Mulligan Kevin
Create a Home Valuation Report for This Property
The Home Valuation Report is an in-depth analysis detailing your home's value as well as a comparison with similar homes in the area
Home Values in the Area
Average Home Value in this Area
Purchase History
| Date | Buyer | Sale Price | Title Company |
|---|---|---|---|
| Lin Qi | $131,200 | Attorney | |
| Secretary Of Hud | -- | None Available | |
| Ocwen Loan Servicing Llc | $145,800 | None Available | |
| Rodgers Jorvas | $195,000 | -- | |
| Mulligan Kevin | $145,000 | -- |
Source: Public Records
Mortgage History
| Date | Status | Borrower | Loan Amount |
|---|---|---|---|
| Open | Lin Qi | $98,400 | |
| Previous Owner | Rodgers Jorvas | $191,987 |
Source: Public Records
Tax History Compared to Growth
Tax History
| Year | Tax Paid | Tax Assessment Tax Assessment Total Assessment is a certain percentage of the fair market value that is determined by local assessors to be the total taxable value of land and additions on the property. | Land | Improvement |
|---|---|---|---|---|
| 2025 | $2,210 | $241,700 | $92,000 | $149,700 |
| 2024 | $2,210 | $227,800 | $88,000 | $139,800 |
| 2023 | $2,208 | $223,000 | $88,000 | $135,000 |
| 2022 | $2,054 | $207,500 | $70,000 | $137,500 |
| 2021 | $1,823 | $184,100 | $60,000 | $124,100 |
| 2020 | $1,788 | $175,700 | $57,000 | $118,700 |
| 2019 | $1,650 | $161,600 | $57,000 | $104,600 |
| 2018 | $1,620 | $161,600 | $57,000 | $104,600 |
| 2017 | $1,597 | $159,300 | $57,000 | $102,300 |
| 2016 | $1,544 | $156,000 | $57,000 | $99,000 |
| 2015 | $1,501 | $151,600 | $57,000 | $94,600 |
| 2014 | $1,395 | $144,700 | $57,000 | $87,700 |
Source: Public Records
Map
Nearby Homes
- 334 Paxford Dr
- 4751 Eldon Ct
- 4995 Century Dr
- 5002 Century Dr
- 4793 Woods Edge Rd
- 277 Weller Blvd
- 4741 Woods Edge Rd
- 378 Kenley Rd
- 512 Mulligan Dr
- 4726 Woods Edge Rd
- 4824 Ledura Rd
- 518 Mulligan Dr
- 5005 Wynne Ct
- 336 Kenley Rd
- 4884 Woods Edge Rd
- 4931 Kemps Lake Dr
- 5004 Wellston Ct
- 435 Greenview Dr
- 5002 Glen Canyon Dr
- 277 Moate Cir