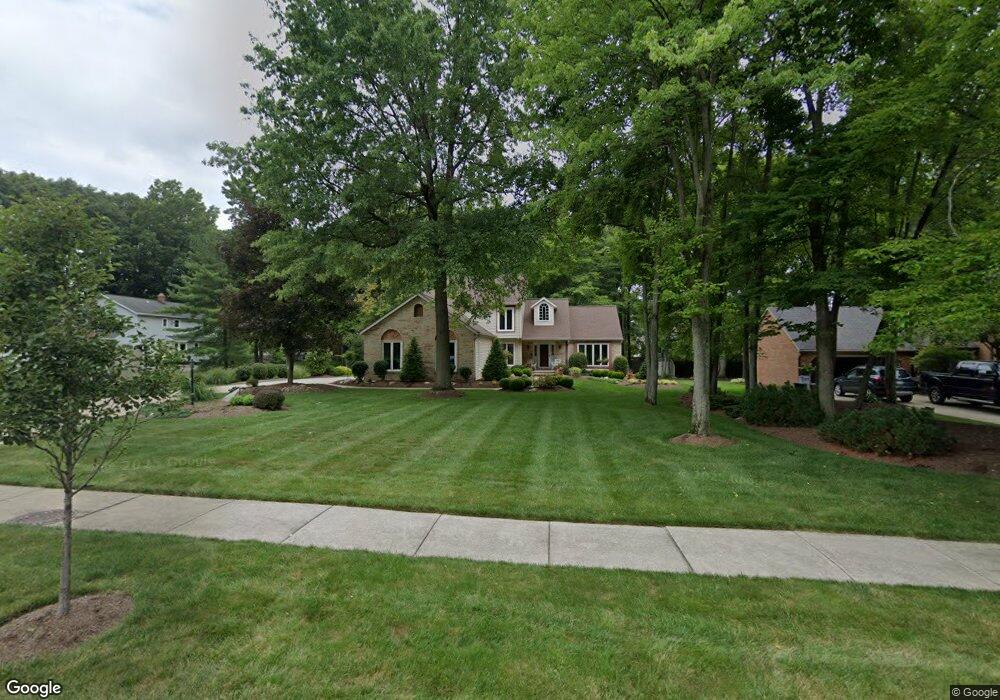
4805 Maple Leaf Ln Independence, OH 44131
Estimated Value: $477,658 - $551,000
4
Beds
3
Baths
2,714
Sq Ft
$192/Sq Ft
Est. Value
About This Home
This home is located at 4805 Maple Leaf Ln, Independence, OH 44131 and is currently estimated at $520,165, approximately $191 per square foot. 4805 Maple Leaf Ln is a home located in Cuyahoga County with nearby schools including Independence Primary School, Independence Middle School, and Independence High School.
Ownership History
Date
Name
Owned For
Owner Type
Purchase Details
Closed on
Oct 6, 2022
Sold by
Edward J Telecky Jr Living Trust and Telecky Linda F
Bought by
Telecky Linda F
Current Estimated Value
Purchase Details
Closed on
Feb 13, 2006
Sold by
Telecky Edward J and Telecky Linda F
Bought by
Telecky Edward J
Purchase Details
Closed on
Oct 7, 1986
Sold by
Bldrsinc T and Bldrsinc T
Bought by
Telecky Edward J
Purchase Details
Closed on
Jun 19, 1985
Bought by
Bldrsinc T and Bldrsinc T
Purchase Details
Closed on
May 24, 1984
Sold by
Masoni John G
Bought by
Troiano Gene Trs
Purchase Details
Closed on
Dec 31, 1981
Bought by
Masoni John G
Purchase Details
Closed on
Jan 1, 1980
Bought by
L & M Prop Co
Create a Home Valuation Report for This Property
The Home Valuation Report is an in-depth analysis detailing your home's value as well as a comparison with similar homes in the area
Home Values in the Area
Average Home Value in this Area
Purchase History
| Date | Buyer | Sale Price | Title Company |
|---|---|---|---|
| Telecky Linda F | -- | None Listed On Document | |
| Telecky Edward J | -- | None Available | |
| Telecky Edward J | $175,100 | -- | |
| Bldrsinc T | -- | -- | |
| Troiano Gene Trs | -- | -- | |
| Masoni John G | -- | -- | |
| L & M Prop Co | -- | -- |
Source: Public Records
Tax History
| Year | Tax Paid | Tax Assessment Tax Assessment Total Assessment is a certain percentage of the fair market value that is determined by local assessors to be the total taxable value of land and additions on the property. | Land | Improvement |
|---|---|---|---|---|
| 2025 | $5,895 | $137,830 | $28,630 | $109,200 |
| 2024 | $6,123 | $137,830 | $28,630 | $109,200 |
| 2023 | $6,192 | $126,810 | $27,480 | $99,330 |
| 2022 | $6,180 | $126,810 | $27,480 | $99,330 |
| 2021 | $6,090 | $126,810 | $27,480 | $99,330 |
| 2020 | $5,915 | $116,340 | $25,200 | $91,140 |
| 2019 | $5,710 | $332,400 | $72,000 | $260,400 |
| 2018 | $5,611 | $116,340 | $25,200 | $91,140 |
| 2017 | $5,573 | $109,060 | $20,930 | $88,130 |
| 2016 | $5,517 | $109,060 | $20,930 | $88,130 |
| 2015 | $5,512 | $109,060 | $20,930 | $88,130 |
| 2014 | $5,512 | $109,060 | $20,930 | $88,130 |
Source: Public Records
Map
Nearby Homes
- 5815 Chestnut Rd
- 6990 S Great Oaks Pkwy
- 0 Acorn Dr Unit 5023848
- 0 Daisy Blvd
- 0 Brecksville Rd
- VL Laura Lee Ln
- VL TBB Laura Lee Ln
- 1324 Mapleview Dr
- 7040 Brecksville Rd
- 7477 Ludwin Dr
- 350 Panorama Dr
- 1026 Joy Oval
- 6258 Carlyle Dr
- 3347 Jasmine Dr
- 6312 E Pleasant Valley Rd
- 5860 N Crossview Rd
- 423 E Decker Dr
- 5981 Northview Dr
- 7163 Lee Dr
- 7003 Brecksville Rd
- 4809 Maple Leaf Ln
- 6613 Beechwood Dr
- 6609 Beechwood Dr
- 4851 Maple Leaf Ln
- 4800 Great Oaks Pkwy
- 6605 Beechwood Dr
- 4806 Great Oaks Pkwy
- 6625 Beechwood Dr
- 4806 Maple Leaf Ln
- 4812 Great Oaks Pkwy
- 6591 Beechwood Dr
- 4891 Maple Leaf Ln
- 4850 Maple Leaf Ln
- 6629 Beechwood Dr
- 4850 Great Oaks Pkwy
- 4890 Maple Leaf Ln
- 5009 Maple Leaf Ln
- 6608 Beechwood Dr
- 6604 Beechwood Dr
Your Personal Tour Guide
Ask me questions while you tour the home.