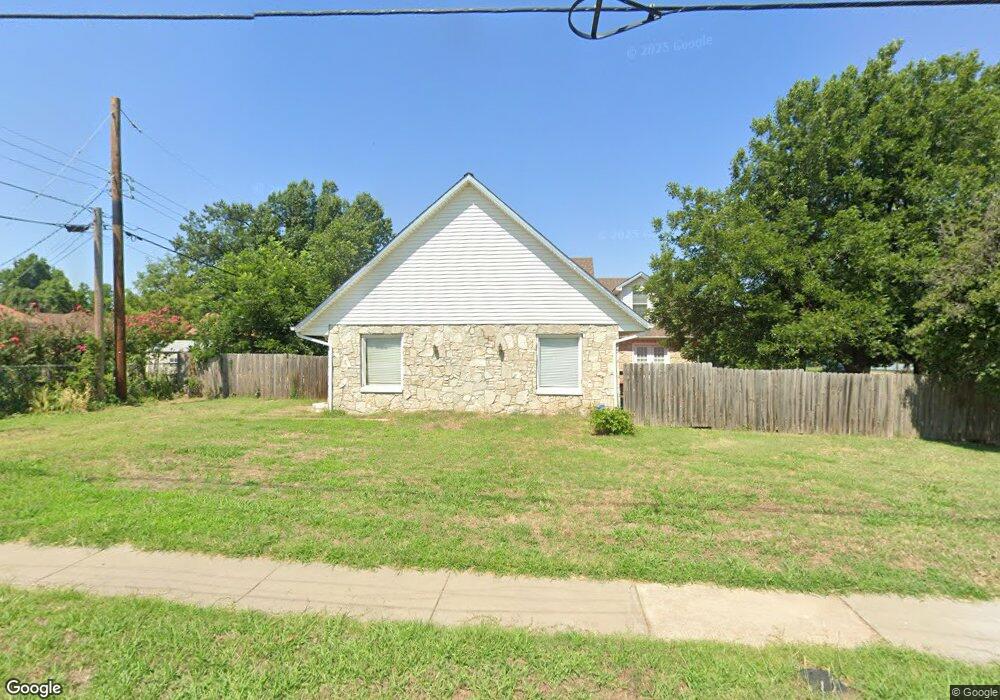
4805 N Ann Arbor Ave Warr Acres, OK 73122
Estimated Value: $321,000 - $397,828
4
Beds
4
Baths
3,130
Sq Ft
$113/Sq Ft
Est. Value
About This Home
This home is located at 4805 N Ann Arbor Ave, Warr Acres, OK 73122 and is currently estimated at $354,957, approximately $113 per square foot. 4805 N Ann Arbor Ave is a home located in Oklahoma County with nearby schools including Arbor Grove Elementary School, James L. Capps Middle School, and Putnam City High School.
Ownership History
Date
Name
Owned For
Owner Type
Purchase Details
Closed on
Nov 22, 2023
Sold by
Mccubbin Charles E
Bought by
Mccubbin Charles E and Mccubbin Louis Yolette
Current Estimated Value
Purchase Details
Closed on
Jul 23, 2013
Sold by
Mccubbin Lynn M
Bought by
Mccubbin Charles E
Purchase Details
Closed on
Apr 16, 2009
Sold by
Mccubbin Charles E and Mccubbin Lynn M
Bought by
Mccubbin Charles E and Mccubbin Lynn M
Home Financials for this Owner
Home Financials are based on the most recent Mortgage that was taken out on this home.
Original Mortgage
$146,400
Interest Rate
5.14%
Mortgage Type
New Conventional
Purchase Details
Closed on
Aug 29, 1997
Sold by
Slover Dennis
Bought by
Mccubbin Charles E
Create a Home Valuation Report for This Property
The Home Valuation Report is an in-depth analysis detailing your home's value as well as a comparison with similar homes in the area
Home Values in the Area
Average Home Value in this Area
Purchase History
| Date | Buyer | Sale Price | Title Company |
|---|---|---|---|
| Mccubbin Charles E | -- | None Listed On Document | |
| Mccubbin Charles E | -- | None Available | |
| Mccubbin Charles E | -- | American Guaranty Title Co | |
| Mccubbin Charles E | $66,000 | American Title & Trust Compa |
Source: Public Records
Mortgage History
| Date | Status | Borrower | Loan Amount |
|---|---|---|---|
| Previous Owner | Mccubbin Charles E | $146,400 |
Source: Public Records
Tax History Compared to Growth
Tax History
| Year | Tax Paid | Tax Assessment Tax Assessment Total Assessment is a certain percentage of the fair market value that is determined by local assessors to be the total taxable value of land and additions on the property. | Land | Improvement |
|---|---|---|---|---|
| 2024 | $1,932 | $17,920 | $3,179 | $14,741 |
| 2023 | $1,932 | $17,399 | $2,836 | $14,563 |
| 2022 | $1,913 | $16,892 | $3,124 | $13,768 |
| 2021 | $1,844 | $16,400 | $3,513 | $12,887 |
| 2020 | $1,792 | $15,923 | $3,543 | $12,380 |
| 2019 | $1,722 | $15,459 | $2,738 | $12,721 |
| 2018 | $1,464 | $15,010 | $0 | $0 |
| 2017 | $1,425 | $14,571 | $2,532 | $12,039 |
| 2016 | $1,383 | $14,147 | $2,369 | $11,778 |
| 2015 | $1,348 | $13,735 | $1,776 | $11,959 |
| 2014 | $1,251 | $13,335 | $1,752 | $11,583 |
Source: Public Records
Map
Nearby Homes
- 5416 NW 46th Terrace
- 5345 NW 44th St
- 4324 N Grove Ave
- 4312 N Grove Ave
- 4600 NW 46th St
- 5800 NW 45th St
- 5505 NW 41st St
- 4112 N Sterling Ave
- 6203 NW 53rd St Unit 48
- 5905 NW 50th St
- 4329 NW 44th St
- 4317 NW 45th St
- 4325 NW 44th St
- 6019 NW 47th St
- 5621 NW 58th Terrace
- 6024 NW 50th St
- 5600 NW 59th St
- 4212 NW 45th St
- 4333 NW 55th St
- 4602 N Redmond Ave
- 5405 NW 46th Terrace
- 5401 NW 46th Terrace
- 5409 NW 46th Terrace
- 5413 NW 46th Terrace
- 4825 N Ann Arbor Ave
- 4716 N Ann Arbor Ave
- 4714 N Ann Arbor Ave
- 4720 N Ann Arbor Ave
- 5417 NW 46th Terrace
- 4712 N Ann Arbor Ave
- 4710 N Ann Arbor Ave
- 5404 NW 46th Terrace
- 5400 NW 46th Terrace
- 5501 NW 46th Terrace
- 4800 N Ann Arbor Ave
- 5408 NW 46th Terrace
- 5320 NW 47th St
- 4708 N Ann Arbor Ave
- 5412 NW 46th Terrace
- 4804 N Ann Arbor Ave