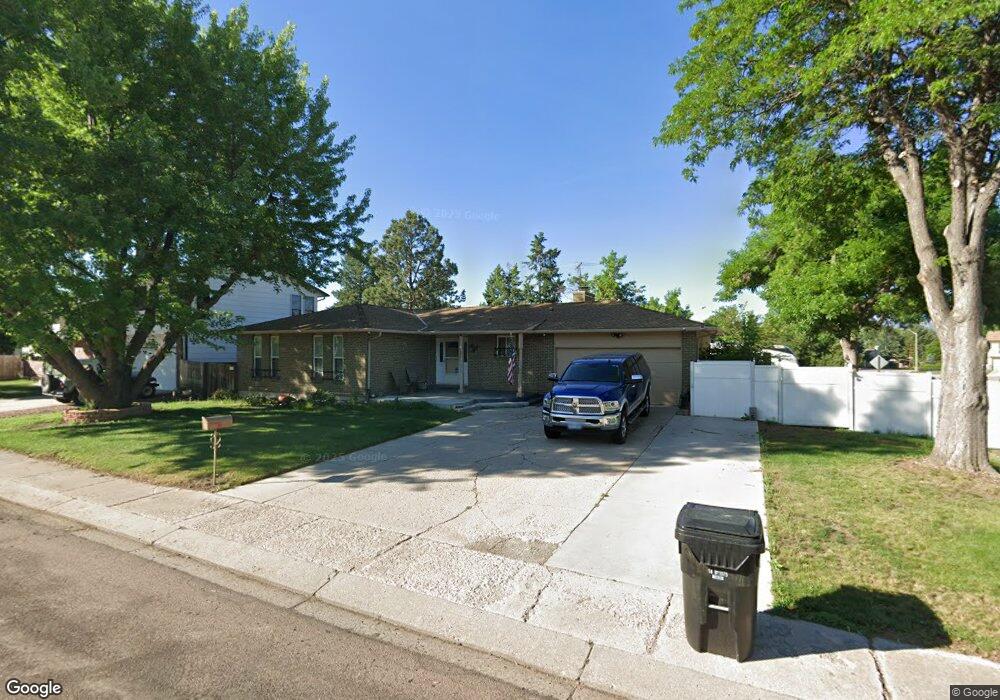
4805 Ranch Dr Colorado Springs, CO 80918
Garden Ranch NeighborhoodEstimated Value: $480,702 - $498,000
5
Beds
3
Baths
1,372
Sq Ft
$355/Sq Ft
Est. Value
About This Home
This home is located at 4805 Ranch Dr, Colorado Springs, CO 80918 and is currently estimated at $486,676, approximately $354 per square foot. 4805 Ranch Dr is a home located in El Paso County with nearby schools including Grant Elementary School, Mann Middle School, and Mitchell High School.
Ownership History
Date
Name
Owned For
Owner Type
Purchase Details
Closed on
Sep 20, 2016
Sold by
Maunez Sergio and Maunez Ratri
Bought by
Trotter Lorenzo A and Trotter Tammie
Current Estimated Value
Home Financials for this Owner
Home Financials are based on the most recent Mortgage that was taken out on this home.
Original Mortgage
$238,450
Outstanding Balance
$190,587
Interest Rate
3.45%
Mortgage Type
New Conventional
Estimated Equity
$296,089
Purchase Details
Closed on
Aug 13, 2009
Sold by
Williams Deborah and Law Jessie O
Bought by
Maynez Sergio and Maynez Ratri
Home Financials for this Owner
Home Financials are based on the most recent Mortgage that was taken out on this home.
Original Mortgage
$206,196
Interest Rate
5.19%
Mortgage Type
FHA
Purchase Details
Closed on
Jun 9, 1995
Sold by
Callaghan Laverne B
Bought by
Williams Deborah and Law Jessie O
Home Financials for this Owner
Home Financials are based on the most recent Mortgage that was taken out on this home.
Original Mortgage
$108,385
Interest Rate
8.17%
Mortgage Type
FHA
Create a Home Valuation Report for This Property
The Home Valuation Report is an in-depth analysis detailing your home's value as well as a comparison with similar homes in the area
Home Values in the Area
Average Home Value in this Area
Purchase History
| Date | Buyer | Sale Price | Title Company |
|---|---|---|---|
| Trotter Lorenzo A | $251,000 | First American Title | |
| Maynez Sergio | $210,000 | Stewart Title | |
| Williams Deborah | $118,000 | First American Title |
Source: Public Records
Mortgage History
| Date | Status | Borrower | Loan Amount |
|---|---|---|---|
| Open | Trotter Lorenzo A | $238,450 | |
| Previous Owner | Maynez Sergio | $206,196 | |
| Previous Owner | Williams Deborah | $108,385 |
Source: Public Records
Tax History Compared to Growth
Tax History
| Year | Tax Paid | Tax Assessment Tax Assessment Total Assessment is a certain percentage of the fair market value that is determined by local assessors to be the total taxable value of land and additions on the property. | Land | Improvement |
|---|---|---|---|---|
| 2025 | $1,526 | $32,750 | -- | -- |
| 2024 | $1,412 | $31,890 | $4,820 | $27,070 |
| 2022 | $1,364 | $24,370 | $3,610 | $20,760 |
| 2021 | $1,479 | $25,070 | $3,720 | $21,350 |
| 2020 | $1,478 | $21,770 | $3,220 | $18,550 |
| 2019 | $1,470 | $21,770 | $3,220 | $18,550 |
| 2018 | $1,288 | $17,550 | $2,160 | $15,390 |
| 2017 | $1,220 | $17,550 | $2,160 | $15,390 |
| 2016 | $1,000 | $17,250 | $2,230 | $15,020 |
| 2015 | $996 | $17,250 | $2,230 | $15,020 |
| 2014 | $935 | $15,540 | $2,230 | $13,310 |
Source: Public Records
Map
Nearby Homes
- 2832 Ridgeglen Way
- 4454 Ranch Cir
- 4623 Ranch Cir
- 5034 El Camino Dr Unit 36
- 5034 El Camino Dr Unit 31
- 5034 El Camino Dr Unit 42
- 4506 Ridgecrest Dr
- 5030 El Camino Dr Unit 8
- 5030 El Camino Dr Unit 1
- 4434 Misty Dr
- 4518 Misty Dr
- 2520 Hamlet Ln Unit A
- 4410 Moonlight Dr
- 5015 Bonita Way
- 4911 Sonata Dr
- 2775 El Capitan Dr
- 4886 Sonata Dr Unit C
- 5140 Villa Cir
- 4858 Sonata Dr Unit D
- 5139 Villa Cir
- 4809 Ranch Dr
- 4801 Ranch Dr
- 2806 Ridgeglen Place
- 4806 Ranch Dr
- 4813 Ranch Dr
- 4729 Ranch Dr
- 4829 Ranch Dr
- 4802 Ranch Dr
- 4817 Ranch Dr
- 2810 Ridgeglen Place
- 4825 Ranch Dr
- 4725 Ranch Dr
- 4814 Ranch Dr
- 4830 Ranch Dr
- 4821 Ranch Dr
- 4506 Ridgeglen Rd
- 4722 Ranch Dr
- 4833 Ranch Dr
- 2803 Ridgeglen Place
- 4822 Ranch Dr