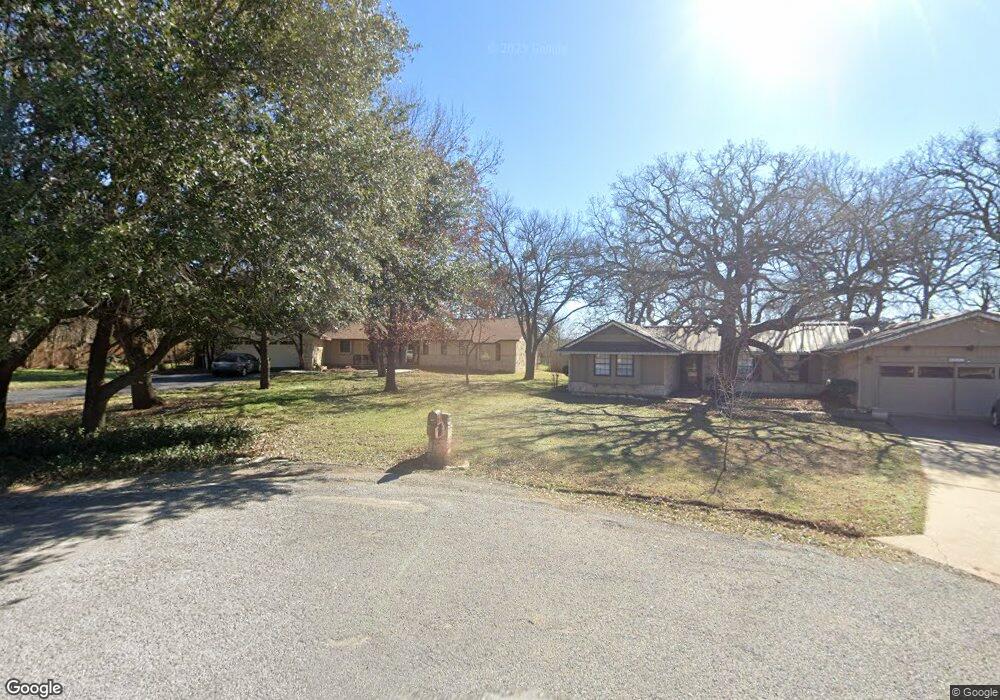
4805 The Trees Ct Granbury, TX 76049
Estimated Value: $340,750 - $369,000
3
Beds
3
Baths
1,847
Sq Ft
$191/Sq Ft
Est. Value
About This Home
This home is located at 4805 The Trees Ct, Granbury, TX 76049 and is currently estimated at $353,438, approximately $191 per square foot. 4805 The Trees Ct is a home located in Hood County with nearby schools including Acton Elementary School, Acton Middle School, and Granbury High School.
Ownership History
Date
Name
Owned For
Owner Type
Purchase Details
Closed on
Mar 17, 2016
Sold by
Hendricks Jessie Eva and Usaa Federal Savings Bank
Bought by
Flannery Errol A and Flannery Heather M
Current Estimated Value
Home Financials for this Owner
Home Financials are based on the most recent Mortgage that was taken out on this home.
Original Mortgage
$171,612
Outstanding Balance
$135,776
Interest Rate
3.72%
Mortgage Type
VA
Estimated Equity
$217,662
Purchase Details
Closed on
Jul 27, 2009
Sold by
Hendricks Kenneth Wayne and Hendricks Jessie Eva
Bought by
Hendricks Kenneth Wayne and Hendricks Jessie Eva
Purchase Details
Closed on
Jun 3, 1997
Sold by
Herrington John E and Herrington Barbara A
Bought by
Flannery Errol A Et Ux Heather M
Purchase Details
Closed on
May 30, 1984
Sold by
Hendricks Kenneth W
Bought by
Flannery Errol A Et Ux Heather M
Create a Home Valuation Report for This Property
The Home Valuation Report is an in-depth analysis detailing your home's value as well as a comparison with similar homes in the area
Home Values in the Area
Average Home Value in this Area
Purchase History
| Date | Buyer | Sale Price | Title Company |
|---|---|---|---|
| Flannery Errol A | -- | Porter Title Company | |
| Hendricks Kenneth Wayne | -- | None Available | |
| Flannery Errol A Et Ux Heather M | -- | -- | |
| Flannery Errol A Et Ux Heather M | -- | -- |
Source: Public Records
Mortgage History
| Date | Status | Borrower | Loan Amount |
|---|---|---|---|
| Open | Flannery Errol A | $171,612 |
Source: Public Records
Tax History Compared to Growth
Tax History
| Year | Tax Paid | Tax Assessment Tax Assessment Total Assessment is a certain percentage of the fair market value that is determined by local assessors to be the total taxable value of land and additions on the property. | Land | Improvement |
|---|---|---|---|---|
| 2025 | $2,084 | $261,520 | $12,000 | $249,520 |
| 2024 | $2,231 | $265,485 | $12,000 | $257,440 |
| 2023 | $2,937 | $277,360 | $12,000 | $265,360 |
| 2022 | $2,519 | $281,320 | $12,000 | $269,320 |
| 2021 | $3,062 | $199,470 | $12,000 | $187,470 |
| 2020 | $2,860 | $184,170 | $12,000 | $172,170 |
| 2019 | $2,994 | $184,170 | $12,000 | $172,170 |
| 2018 | $2,803 | $172,420 | $12,000 | $160,420 |
| 2017 | $2,673 | $159,860 | $12,000 | $147,860 |
| 2016 | $2,194 | $131,210 | $12,000 | $119,210 |
| 2015 | $508 | $128,090 | $12,000 | $116,090 |
| 2014 | $508 | $128,090 | $12,000 | $116,090 |
Source: Public Records
Map
Nearby Homes
- 3218 Fountain Way
- 4512 Cimmaron Trail
- 4920 Centre Ct
- 5003 Bueno Dr
- 3510 Fountain Way
- 5102 Largo Dr
- 2918 James Rd
- 2925 Willow Ridge Cir
- 3207 Hummingbird Ct
- 4901 Fairway Ct
- 2936 Willow Ridge Cir
- 1141 Avery Rd
- 1144 Avery Rd
- 1136 Avery Rd
- 4900 Del Rio Ct
- 4904 Fairway Place Ct
- 5040 Santa Elena Ct
- 5041 Santa Elena Ct
- 3620 Montgomery Dr
- 4009 Scenic Way
- 4803 The Trees Ct
- 4807 The Trees Ct
- 4801 The Trees Ct
- 4804 The Trees Ct
- 4806 The Trees Ct
- 4802 The Trees Ct
- 4800 The Trees Ct
- 5102 Seminole Dr
- 5100 Seminole Dr
- 5104 Seminole Dr
- 3212 James Rd
- 5106 Seminole Dr
- 3213 Crossbridge Cir
- 3211 Crossbridge Cir
- 5108 Seminole Dr
- 5016 Seminole Dr
- 5016 Seminole Dr
- 3220 Fountain Way
- 3204 Leatherwood Ct
- 5110 Seminole Dr