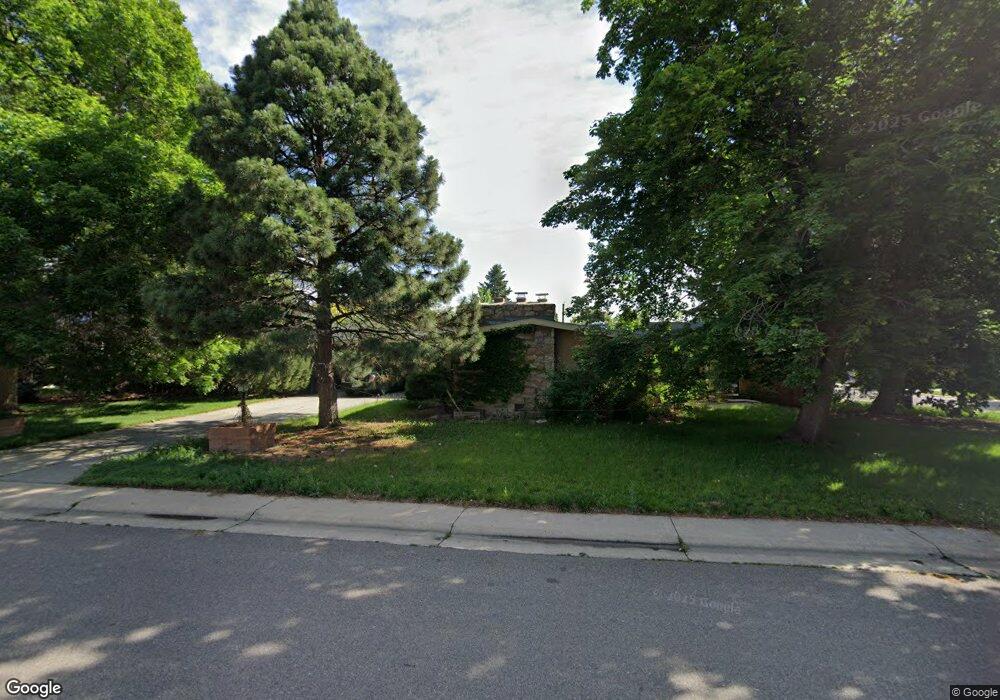
4805 W Lakeridge Rd Denver, CO 80219
Harvey Park NeighborhoodEstimated Value: $652,000 - $980,000
4
Beds
3
Baths
3,065
Sq Ft
$266/Sq Ft
Est. Value
About This Home
This home is located at 4805 W Lakeridge Rd, Denver, CO 80219 and is currently estimated at $814,284, approximately $265 per square foot. 4805 W Lakeridge Rd is a home located in Denver County with nearby schools including Bear Valley International School, John F Kennedy High School, and Excel Academy.
Ownership History
Date
Name
Owned For
Owner Type
Purchase Details
Closed on
Oct 2, 2012
Sold by
Whyte Gregory R
Bought by
Wise Joshua Paul Quincy and Baca Wise Elisa Louise
Current Estimated Value
Home Financials for this Owner
Home Financials are based on the most recent Mortgage that was taken out on this home.
Original Mortgage
$325,850
Outstanding Balance
$227,650
Interest Rate
3.7%
Mortgage Type
New Conventional
Estimated Equity
$586,634
Purchase Details
Closed on
Jan 11, 2012
Sold by
Florentin Clifford W and Florentin Margaret M G
Bought by
Whyte Gregory R
Home Financials for this Owner
Home Financials are based on the most recent Mortgage that was taken out on this home.
Original Mortgage
$210,000
Interest Rate
4.04%
Mortgage Type
New Conventional
Create a Home Valuation Report for This Property
The Home Valuation Report is an in-depth analysis detailing your home's value as well as a comparison with similar homes in the area
Home Values in the Area
Average Home Value in this Area
Purchase History
| Date | Buyer | Sale Price | Title Company |
|---|---|---|---|
| Wise Joshua Paul Quincy | $352,500 | Land Title Guarantee Company | |
| Whyte Gregory R | $335,000 | Ats |
Source: Public Records
Mortgage History
| Date | Status | Borrower | Loan Amount |
|---|---|---|---|
| Open | Wise Joshua Paul Quincy | $325,850 | |
| Previous Owner | Whyte Gregory R | $210,000 |
Source: Public Records
Tax History Compared to Growth
Tax History
| Year | Tax Paid | Tax Assessment Tax Assessment Total Assessment is a certain percentage of the fair market value that is determined by local assessors to be the total taxable value of land and additions on the property. | Land | Improvement |
|---|---|---|---|---|
| 2024 | $4,365 | $55,110 | $17,990 | $37,120 |
| 2023 | $4,270 | $55,110 | $17,990 | $37,120 |
| 2022 | $3,241 | $40,750 | $22,480 | $18,270 |
| 2021 | $3,241 | $41,930 | $23,130 | $18,800 |
| 2020 | $2,937 | $39,590 | $23,130 | $16,460 |
| 2019 | $2,855 | $39,590 | $23,130 | $16,460 |
| 2018 | $2,182 | $28,200 | $11,180 | $17,020 |
| 2017 | $2,175 | $28,200 | $11,180 | $17,020 |
| 2016 | $2,477 | $30,380 | $10,300 | $20,080 |
| 2015 | $2,374 | $30,380 | $10,300 | $20,080 |
| 2014 | $1,875 | $22,580 | $4,410 | $18,170 |
Source: Public Records
Map
Nearby Homes
- 2630 S Wolff Way
- 2650 S Sheridan Ct Unit 2
- 2529 S Utica St
- 5317 W Iliff Dr Unit 101
- 2545 S Tennyson Way
- 2733 S Vrain St
- 2548 S Tennyson Way
- 5661 W Lakeridge Rd
- 2861 S Yates St
- 2597 S Perry St
- 2571 S Perry St
- 2621 S Perry St
- 2849 S Depew St
- 2595 S Harlan Ct
- 2090 S Wolff St
- 2782 S Fenton St
- 2650 S Perry St
- 5611 W Bates Ave
- 2067 S Yates St
- 2088 S Winona Ct
- 2605 S Wolff St
- 4855 W Lakeridge Rd
- 4800 W Lakeridge Rd
- 4800 W Vassar Ave
- 4905 W Lakeridge Rd
- 2604 S Wolff St
- 4755 W Lakeridge Rd
- 4860 W Vassar Ave
- 4790 W Vassar Ave
- 4935 W Lakeridge Rd
- 4900 W Lakeridge Rd
- 4890 W Vassar Ave
- 2621 S Wolff Way
- 4900 W Vassar Ave
- 4760 W Vassar Ave
- 4950 W Lakeridge Rd
- 4965 W Lakeridge Rd
- 2595 S Wolff St
- 4705 W Lakeridge Rd
- 4920 W Vassar Ave