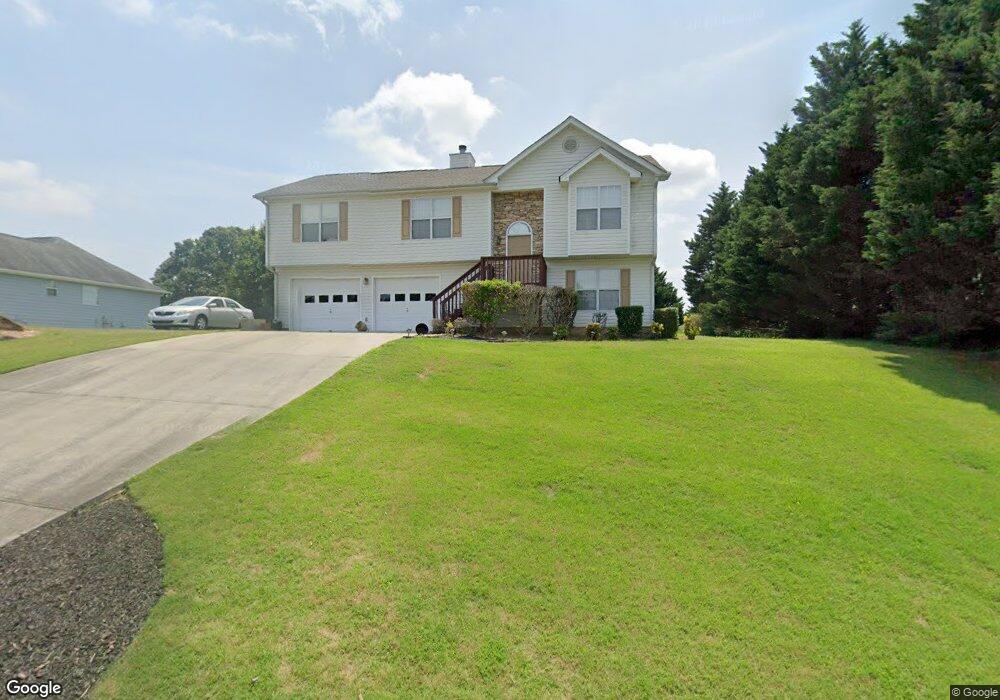
4806 Canberra Way Flowery Branch, GA 30542
Estimated Value: $332,000 - $354,000
3
Beds
2
Baths
1,339
Sq Ft
$257/Sq Ft
Est. Value
About This Home
This home is located at 4806 Canberra Way, Flowery Branch, GA 30542 and is currently estimated at $343,657, approximately $256 per square foot. 4806 Canberra Way is a home located in Hall County with nearby schools including Martin Elementary School, Southwest Middle School, and C.W. Davis Middle School.
Ownership History
Date
Name
Owned For
Owner Type
Purchase Details
Closed on
Mar 7, 2013
Sold by
Roman Santos
Bought by
Roman Zulma Ivette
Current Estimated Value
Purchase Details
Closed on
Jan 8, 2002
Sold by
Roman Zulma I
Bought by
Roman Zulma I and Roman Santos
Home Financials for this Owner
Home Financials are based on the most recent Mortgage that was taken out on this home.
Original Mortgage
$101,508
Interest Rate
6.81%
Mortgage Type
New Conventional
Purchase Details
Closed on
Oct 27, 2000
Sold by
Dms Builders Inc
Bought by
Roman Zulma I
Home Financials for this Owner
Home Financials are based on the most recent Mortgage that was taken out on this home.
Original Mortgage
$101,648
Interest Rate
7.93%
Mortgage Type
FHA
Purchase Details
Closed on
Aug 11, 2000
Sold by
Cash Road Joint Venture
Bought by
Dms Builders Inc
Create a Home Valuation Report for This Property
The Home Valuation Report is an in-depth analysis detailing your home's value as well as a comparison with similar homes in the area
Home Values in the Area
Average Home Value in this Area
Purchase History
| Date | Buyer | Sale Price | Title Company |
|---|---|---|---|
| Roman Zulma Ivette | -- | -- | |
| Roman Zulma I | -- | -- | |
| Roman Zulma I | $125,500 | -- | |
| Dms Builders Inc | $132,500 | -- |
Source: Public Records
Mortgage History
| Date | Status | Borrower | Loan Amount |
|---|---|---|---|
| Previous Owner | Roman Zulma I | $101,508 | |
| Previous Owner | Roman Zulma I | $101,648 |
Source: Public Records
Tax History Compared to Growth
Tax History
| Year | Tax Paid | Tax Assessment Tax Assessment Total Assessment is a certain percentage of the fair market value that is determined by local assessors to be the total taxable value of land and additions on the property. | Land | Improvement |
|---|---|---|---|---|
| 2024 | $3,051 | $120,000 | $22,560 | $97,440 |
| 2023 | $2,913 | $130,120 | $22,560 | $107,560 |
| 2022 | $2,215 | $82,680 | $10,000 | $72,680 |
| 2021 | $2,061 | $75,320 | $10,000 | $65,320 |
| 2020 | $2,035 | $72,280 | $10,000 | $62,280 |
| 2019 | $2,142 | $75,600 | $9,440 | $66,160 |
| 2018 | $2,062 | $70,360 | $9,000 | $61,360 |
| 2017 | $1,546 | $52,640 | $9,000 | $43,640 |
| 2016 | $1,511 | $52,640 | $9,000 | $43,640 |
| 2015 | $836 | $52,640 | $9,000 | $43,640 |
| 2014 | $836 | $27,710 | $4,480 | $23,230 |
Source: Public Records
Map
Nearby Homes
- 4827 Daintree Ct
- 4947 Cash Rd
- 4695 Eucalyptus Way
- 4826 Rose Heights Dr
- 4674 Quail Pointe Dr
- 6151 Spout Springs Rd
- 4647 Laurel Brook Dr
- 5021 Limerick Ln
- 4864 Grandview Ct
- 4860 Grandview Ct
- 7344 Rocklin Ln
- 5619 Chickory Dr Unit 126
- 5651 Chickory Dr Unit 118
- 5059 Lancashire Ct
- 6229 Ivy Springs Dr
- 6512 Shady Valley Dr
- 4810 Canberra Way
- 4717 Melbourne Trail
- 4807 Daintree Ct
- 4723 Melbourne Trail
- 4814 Canberra Way
- 4805 Canberra Way
- 4801 Canberra Way
- 4815 Daintree Ct
- 4809 Canberra Way
- 4716 Melbourne Trail
- 4712 Melbourne Trail
- 4720 Melbourne Trail
- 4818 Canberra Way
- 4708 Melbourne Trail
- 4813 Canberra Way
- 0 Melbourne Trail Unit 7501090
- 0 Melbourne Trail Unit 7481642
- 0 Melbourne Trail Unit 7319068
- 0 Melbourne Trail Unit 8565987
- 0 Melbourne Trail Unit 8049533