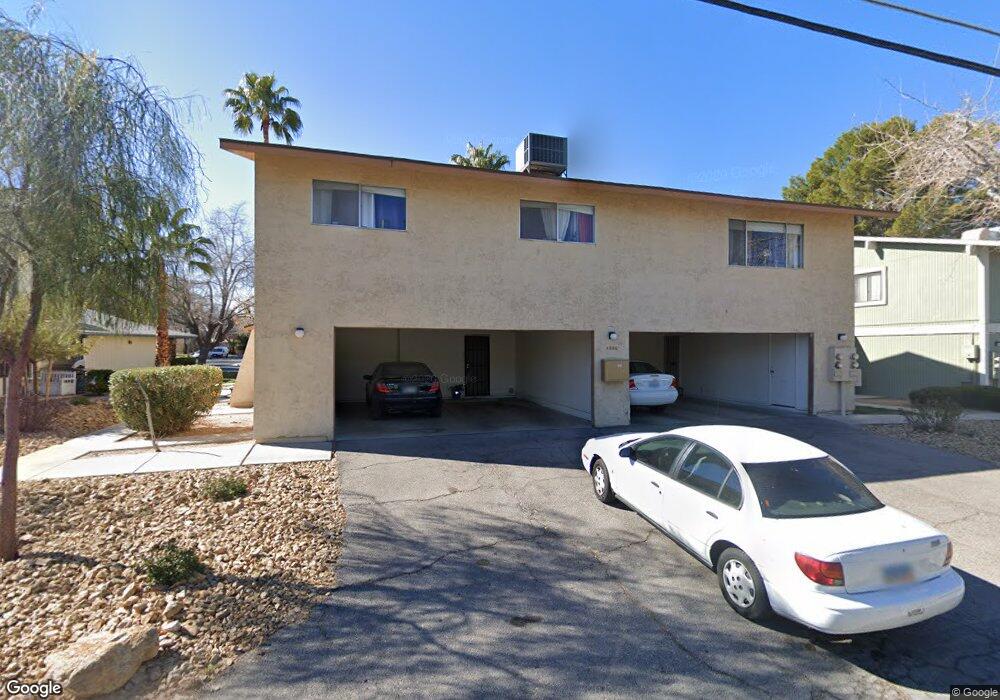
4806 Roberta St Unit 4 Las Vegas, NV 89119
University District NeighborhoodEstimated Value: $173,000 - $204,000
2
Beds
1
Bath
1,056
Sq Ft
$179/Sq Ft
Est. Value
About This Home
This home is located at 4806 Roberta St Unit 4, Las Vegas, NV 89119 and is currently estimated at $189,198, approximately $179 per square foot. 4806 Roberta St Unit 4 is a home located in Clark County with nearby schools including Lewis E Rowe Elementary School, William E. Orr Middle School, and Del Sol Academy of the Performing Arts.
Ownership History
Date
Name
Owned For
Owner Type
Purchase Details
Closed on
Jun 4, 2009
Sold by
Hsbc Bank Usa National Association
Bought by
Kattan David
Current Estimated Value
Purchase Details
Closed on
Mar 12, 2009
Sold by
Madden Beth A
Bought by
Hsbc Bank Usa National Association and Phh2007-1
Purchase Details
Closed on
Mar 16, 2004
Sold by
Naugle Jason
Bought by
Madden Beth
Home Financials for this Owner
Home Financials are based on the most recent Mortgage that was taken out on this home.
Original Mortgage
$80,750
Interest Rate
6.2%
Mortgage Type
Unknown
Purchase Details
Closed on
May 24, 1999
Sold by
Larsen Harold J and Larsen Roberta F
Bought by
Naugle Jason
Home Financials for this Owner
Home Financials are based on the most recent Mortgage that was taken out on this home.
Original Mortgage
$61,110
Interest Rate
7.01%
Mortgage Type
FHA
Create a Home Valuation Report for This Property
The Home Valuation Report is an in-depth analysis detailing your home's value as well as a comparison with similar homes in the area
Home Values in the Area
Average Home Value in this Area
Purchase History
| Date | Buyer | Sale Price | Title Company |
|---|---|---|---|
| Kattan David | $52,000 | Equity Title Eastern | |
| Hsbc Bank Usa National Association | $90,909 | Fidelity National Default So | |
| Madden Beth | $85,000 | Stewart Title Of Nevada | |
| Naugle Jason | $63,000 | First American Title Co |
Source: Public Records
Mortgage History
| Date | Status | Borrower | Loan Amount |
|---|---|---|---|
| Previous Owner | Madden Beth | $80,750 | |
| Previous Owner | Naugle Jason | $61,110 |
Source: Public Records
Tax History Compared to Growth
Tax History
| Year | Tax Paid | Tax Assessment Tax Assessment Total Assessment is a certain percentage of the fair market value that is determined by local assessors to be the total taxable value of land and additions on the property. | Land | Improvement |
|---|---|---|---|---|
| 2025 | $672 | $24,781 | $15,050 | $9,731 |
| 2024 | $623 | $24,781 | $15,050 | $9,731 |
| 2023 | $623 | $31,772 | $22,750 | $9,022 |
| 2022 | $577 | $25,013 | $16,450 | $8,563 |
| 2021 | $534 | $24,341 | $15,750 | $8,591 |
| 2020 | $493 | $24,194 | $15,400 | $8,794 |
| 2019 | $462 | $20,920 | $11,900 | $9,020 |
| 2018 | $441 | $15,994 | $7,000 | $8,994 |
| 2017 | $461 | $15,731 | $6,300 | $9,431 |
| 2016 | $414 | $14,037 | $4,200 | $9,837 |
| 2015 | $412 | $13,901 | $4,200 | $9,701 |
| 2014 | $408 | $15,730 | $5,075 | $10,655 |
Source: Public Records
Map
Nearby Homes
- 1481 Lorilyn Ave Unit 1
- 1521 Elizabeth Ave Unit 4
- 1454 Elizabeth Ave Unit 3
- 1407 Dorothy Ave Unit 3
- 1393 Dorothy Ave Unit 1
- 1433 Santa Anita Dr Unit D
- 1467 Hialeah Dr Unit D
- 1500 Hialeah Dr Unit C
- 1500 Hialeah Dr Unit A
- 1569 Hialeah Dr
- 1337 Dorothy Ave Unit 3
- 1511 Living Desert Dr Unit C
- 1321 Lorilyn Ave Unit 1
- 1375 Hialeah Dr Unit C
- 1309 Dorothy Ave Unit 2
- 1307 Lorilyn Ave Unit 1
- 1400 Hialeah Dr Unit B
- 1321 Del Mar St Unit 4
- 5015 Spencer St Unit C
- 1675 Jupiter Ct Unit C
- 4806 Roberta St
- 4806 Roberta St Unit 2
- 4806 Roberta St Unit 1
- 4806 Roberta St Unit 3
- 4794 Roberta St Unit 4
- 4794 Roberta St Unit 2
- 4794 Roberta St Unit 1
- 4794 Roberta St Unit 3
- 4814 Roberta St Unit 1
- 4814 Roberta St Unit 2
- 4814 Roberta St Unit 3
- 4814 Roberta St Unit 4
- 4782 Roberta St Unit 4
- 4782 Roberta St Unit 3
- 4782 Roberta St Unit 2
- 1587 Elizabeth Ave Unit 4
- 1587 Elizabeth Ave Unit 3
- 1587 Elizabeth Ave Unit 2
- 1587 Elizabeth Ave Unit 1
- 1572 Elizabeth Ave