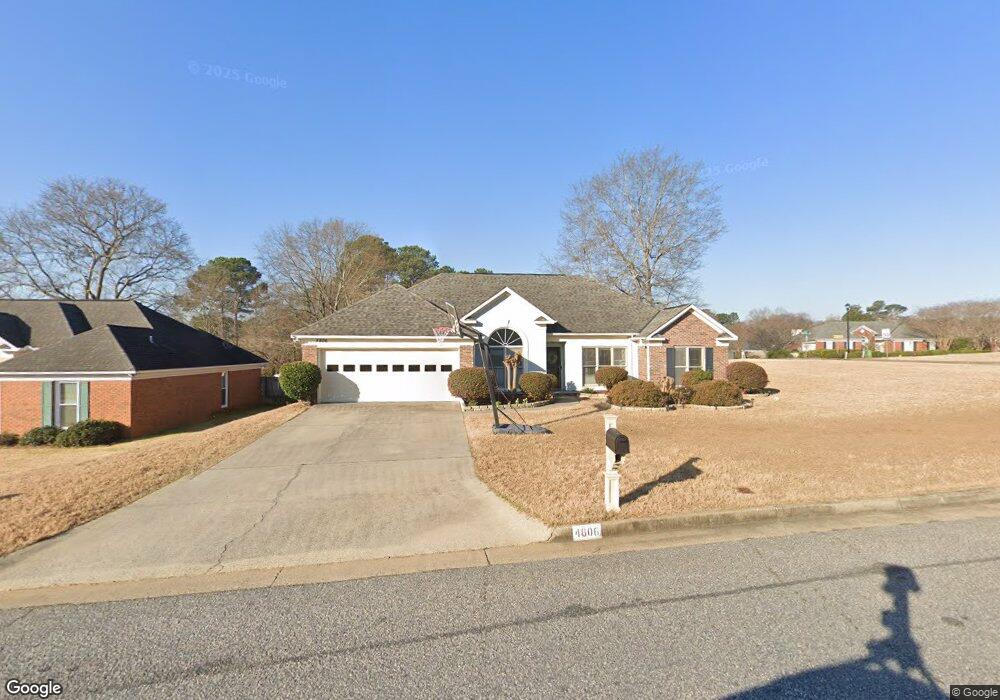
4806 Spring Ridge Dr Columbus, GA 31909
North Columbus NeighborhoodEstimated Value: $300,023 - $341,000
3
Beds
3
Baths
1,948
Sq Ft
$162/Sq Ft
Est. Value
About This Home
This home is located at 4806 Spring Ridge Dr, Columbus, GA 31909 and is currently estimated at $314,756, approximately $161 per square foot. 4806 Spring Ridge Dr is a home located in Muscogee County with nearby schools including Eagle Ridge Academy, Blackmon Road Middle School, and Shaw High School.
Ownership History
Date
Name
Owned For
Owner Type
Purchase Details
Closed on
Jun 22, 2018
Sold by
Weigel Brenda Lynn
Bought by
Verma Manoj Kumar
Current Estimated Value
Home Financials for this Owner
Home Financials are based on the most recent Mortgage that was taken out on this home.
Original Mortgage
$176,000
Outstanding Balance
$152,551
Interest Rate
4.6%
Mortgage Type
New Conventional
Estimated Equity
$162,205
Purchase Details
Closed on
Jun 29, 2015
Sold by
Pineda Edward T
Bought by
Weigel Brends Lynn
Home Financials for this Owner
Home Financials are based on the most recent Mortgage that was taken out on this home.
Original Mortgage
$206,610
Interest Rate
3.93%
Mortgage Type
New Conventional
Purchase Details
Closed on
Jul 27, 2011
Sold by
Barksdale J Lawrence
Bought by
Pineda Edward T
Home Financials for this Owner
Home Financials are based on the most recent Mortgage that was taken out on this home.
Original Mortgage
$199,050
Interest Rate
4.53%
Mortgage Type
VA
Create a Home Valuation Report for This Property
The Home Valuation Report is an in-depth analysis detailing your home's value as well as a comparison with similar homes in the area
Home Values in the Area
Average Home Value in this Area
Purchase History
| Date | Buyer | Sale Price | Title Company |
|---|---|---|---|
| Verma Manoj Kumar | $220,000 | -- | |
| Weigel Brends Lynn | $213,000 | -- | |
| Pineda Edward T | $194,900 | -- |
Source: Public Records
Mortgage History
| Date | Status | Borrower | Loan Amount |
|---|---|---|---|
| Open | Verma Manoj Kumar | $176,000 | |
| Previous Owner | Weigel Brends Lynn | $206,610 | |
| Previous Owner | Pineda Edward T | $199,050 |
Source: Public Records
Tax History
| Year | Tax Paid | Tax Assessment Tax Assessment Total Assessment is a certain percentage of the fair market value that is determined by local assessors to be the total taxable value of land and additions on the property. | Land | Improvement |
|---|---|---|---|---|
| 2025 | $2,412 | $100,280 | $17,420 | $82,860 |
| 2024 | $2,411 | $100,280 | $17,420 | $82,860 |
| 2023 | $1,732 | $100,280 | $17,420 | $82,860 |
| 2022 | $2,514 | $78,264 | $17,420 | $60,844 |
| 2021 | $2,508 | $74,804 | $17,420 | $57,384 |
| 2020 | $2,508 | $74,804 | $17,420 | $57,384 |
| 2019 | $2,518 | $74,804 | $17,420 | $57,384 |
| 2018 | $2,647 | $74,804 | $17,420 | $57,384 |
| 2017 | $2,657 | $74,804 | $17,420 | $57,384 |
| 2016 | $2,668 | $77,960 | $9,658 | $68,302 |
| 2015 | $3,220 | $77,960 | $9,658 | $68,302 |
| 2014 | $3,224 | $77,960 | $9,658 | $68,302 |
| 2013 | -- | $77,960 | $9,658 | $68,302 |
Source: Public Records
Map
Nearby Homes
- 4824 Spring Ridge Ct
- 4842 Champion's Way
- 4850 Champions Way
- 7962 Muirfield Ct
- 1083 Watervalley Dr
- 4857 Turnberry Ln
- 7973 Oakmont Ct
- 4898 Champions Way
- 8739 Palazzo Place
- 8848 Promenade Place
- 8890 Promenade Place
- 7807 Kolven Cove
- 4730 Turnberry Ln Unit 15
- 8507 Galena Rd
- 7113 Pinewood Ct
- 4603 Mayo Dr
- 7168 Pinewood Ct
- 2040 Old Guard Rd
- 2040 / 2048 Old Guard Rd
- 4628 Boston Ivy Dr
- 4812 Spring Ridge Dr
- 4820 Cedar Ridge Dr
- 4795 Spring Ridge Dr
- 4825 Spring Ridge Ct
- 4816 Cedar Ridge Dr
- 4829 Spring Ridge Ct
- 4805 Spring Ridge Dr
- 8001 Cedar Pointe Ct
- 4801 Spring Ridge Dr
- 4821 Spring Ridge Ct
- 4831 Cedar Ridge Dr
- 8004 Cedar Pointe Ct
- 4883 Springwood Cir
- 4900 Cedar Ridge Ct
- 4877 Springwood Cir
- 4835 Cedar Ridge Dr
- 8009 Cedar Pointe Ct
- 4904 Cedar Ridge Ct
- 4871 Springwood Cir
- 4809 Spring Ridge Dr
Your Personal Tour Guide
Ask me questions while you tour the home.