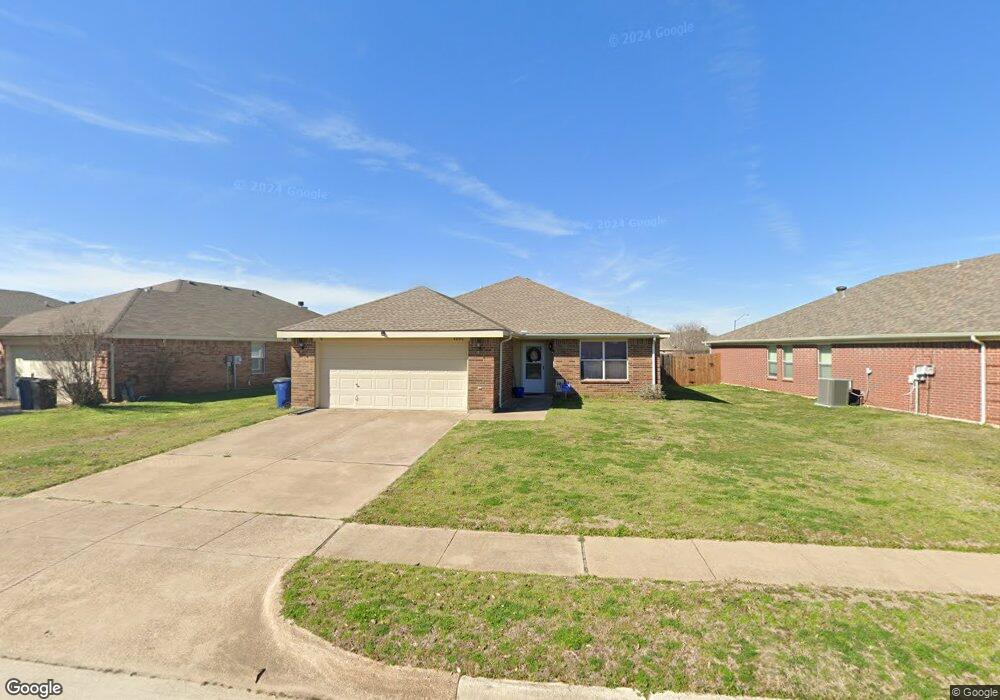
4806 Topaz Ln Granbury, TX 76049
Estimated Value: $279,603 - $312,000
3
Beds
2
Baths
1,642
Sq Ft
$182/Sq Ft
Est. Value
About This Home
This home is located at 4806 Topaz Ln, Granbury, TX 76049 and is currently estimated at $299,151, approximately $182 per square foot. 4806 Topaz Ln is a home located in Hood County with nearby schools including Oak Woods School, Acton Middle School, and Granbury High School.
Ownership History
Date
Name
Owned For
Owner Type
Purchase Details
Closed on
Jun 24, 2019
Sold by
Mayes Stephen Daniel and Mayes James Ray
Bought by
Mayes Stephen Daniel and Mayes Cheri Ann
Current Estimated Value
Purchase Details
Closed on
May 12, 2016
Sold by
Mayes James R & Elaine M Tr
Bought by
Mayes Stephen Daniel Trustee
Purchase Details
Closed on
Sep 19, 2006
Sold by
Mayes James Ray
Bought by
Mayes James Ray and Mayes Elaine Marie
Purchase Details
Closed on
Jul 29, 2005
Sold by
Mayers James and Mayers Lois
Bought by
Mayes James Ray and The Mayes Family Trust
Purchase Details
Closed on
Mar 18, 2004
Sold by
History Maker Homes Llc
Bought by
Mayes Stephen Daniel Trustee
Purchase Details
Closed on
Dec 11, 2002
Sold by
Jasper Development Ltd
Bought by
Mayes Stephen Daniel Trustee
Purchase Details
Closed on
Nov 2, 2001
Sold by
Granbury Medical Properties
Bought by
Mayes Stephen Daniel Trustee
Create a Home Valuation Report for This Property
The Home Valuation Report is an in-depth analysis detailing your home's value as well as a comparison with similar homes in the area
Home Values in the Area
Average Home Value in this Area
Purchase History
| Date | Buyer | Sale Price | Title Company |
|---|---|---|---|
| Mayes Stephen Daniel | -- | None Available | |
| Mayes Stephen Daniel Trustee | -- | -- | |
| Mayes James Ray | -- | None Available | |
| Mayes James Ray | -- | None Available | |
| Mayes James Ray | -- | None Available | |
| Mayes Stephen Daniel Trustee | -- | -- | |
| Mayes Stephen Daniel Trustee | -- | -- | |
| Mayes Stephen Daniel Trustee | -- | -- |
Source: Public Records
Tax History Compared to Growth
Tax History
| Year | Tax Paid | Tax Assessment Tax Assessment Total Assessment is a certain percentage of the fair market value that is determined by local assessors to be the total taxable value of land and additions on the property. | Land | Improvement |
|---|---|---|---|---|
| 2025 | $3,200 | $268,660 | $30,000 | $238,660 |
| 2024 | $3,014 | $250,382 | $30,000 | $235,160 |
| 2023 | $3,646 | $270,830 | $30,000 | $240,830 |
| 2022 | $3,139 | $239,270 | $25,000 | $214,270 |
| 2021 | $3,633 | $188,120 | $25,000 | $163,120 |
| 2020 | $3,474 | $177,920 | $25,000 | $152,920 |
| 2019 | $3,307 | $163,290 | $25,000 | $138,290 |
| 2018 | $3,116 | $153,860 | $25,000 | $128,860 |
| 2017 | $2,903 | $140,270 | $20,000 | $120,270 |
| 2016 | $2,785 | $134,540 | $20,000 | $114,540 |
| 2015 | $2,605 | $130,110 | $20,000 | $110,110 |
| 2014 | $2,605 | $126,810 | $20,000 | $106,810 |
Source: Public Records
Map
Nearby Homes
- 4816 Topaz Ln
- 4823 Topaz Ln
- 4726 Topaz Ln
- 4203 Jasper Ln
- 4712 Topaz Ln
- 229 Jacinth Ln
- 712 Rolling Terrace Cir
- 422 Woodcreek Ct
- 428 Penny Ct
- 5284 E Us Highway 377
- 4400 Kristy Ct
- 700 Temple Hall Hwy
- 2401 True Grit Way
- 4406 Bobbie Ann Dr
- 4404 Bobbie Ann Dr
- 109 Seabiscuit Ct
- 101 Seabiscuit Ct
- 105 Seabiscuit Ct
- 204 Affirmed Ct
- 205 Affirmed Ct