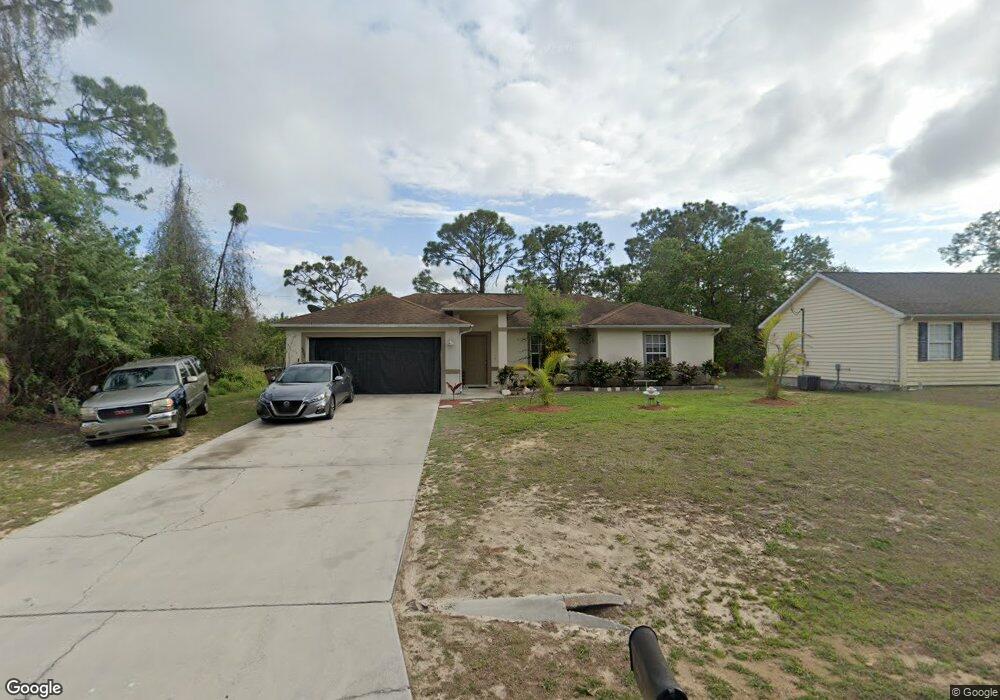
4807 5th St W Unit 2 Lehigh Acres, FL 33971
Centennial NeighborhoodEstimated Value: $255,000 - $301,000
4
Beds
3
Baths
1,362
Sq Ft
$204/Sq Ft
Est. Value
About This Home
This home is located at 4807 5th St W Unit 2, Lehigh Acres, FL 33971 and is currently estimated at $277,197, approximately $203 per square foot. 4807 5th St W Unit 2 is a home located in Lee County with nearby schools including Gateway Elementary School, Lehigh Elementary School, and Tice Elementary School.
Ownership History
Date
Name
Owned For
Owner Type
Purchase Details
Closed on
Dec 4, 2019
Sold by
Umstead Richard and Umstead Richard L
Bought by
Umstead Richard
Current Estimated Value
Purchase Details
Closed on
Dec 14, 2018
Sold by
Umstead Tami
Bought by
Umstead Richard and Umstead Richard L
Purchase Details
Closed on
Feb 3, 2011
Sold by
Frost Investments Llc
Bought by
Umstead Richard and Umstead Tami
Purchase Details
Closed on
Jan 28, 2010
Sold by
Festino Raymond S and Festino Antoinette
Bought by
Frost Investments Llc
Purchase Details
Closed on
Aug 5, 2005
Sold by
Holland William Arthur and Holland Myrtle Louise
Bought by
Festino Raymond S and Festino Antoinette
Home Financials for this Owner
Home Financials are based on the most recent Mortgage that was taken out on this home.
Original Mortgage
$179,820
Interest Rate
5.71%
Mortgage Type
Construction
Create a Home Valuation Report for This Property
The Home Valuation Report is an in-depth analysis detailing your home's value as well as a comparison with similar homes in the area
Home Values in the Area
Average Home Value in this Area
Purchase History
| Date | Buyer | Sale Price | Title Company |
|---|---|---|---|
| Umstead Richard | -- | None Available | |
| Umstead Richard | -- | Attorney | |
| Umstead Richard | $57,887 | Accu Title Agency | |
| Frost Investments Llc | $50,000 | Florida Title One Llc | |
| Festino Raymond S | $49,900 | Morgan & Associates Title Co |
Source: Public Records
Mortgage History
| Date | Status | Borrower | Loan Amount |
|---|---|---|---|
| Previous Owner | Festino Raymond S | $179,820 |
Source: Public Records
Tax History Compared to Growth
Tax History
| Year | Tax Paid | Tax Assessment Tax Assessment Total Assessment is a certain percentage of the fair market value that is determined by local assessors to be the total taxable value of land and additions on the property. | Land | Improvement |
|---|---|---|---|---|
| 2025 | $3,377 | $203,256 | $43,605 | $159,651 |
| 2024 | $3,277 | $193,833 | -- | -- |
| 2023 | $3,277 | $176,212 | $0 | $0 |
| 2022 | $2,787 | $160,193 | $0 | $0 |
| 2021 | $2,390 | $145,630 | $8,500 | $137,130 |
| 2020 | $2,324 | $136,472 | $8,500 | $127,972 |
| 2019 | $2,382 | $136,465 | $5,800 | $130,665 |
| 2018 | $1,997 | $125,167 | $5,500 | $119,667 |
| 2017 | $1,898 | $117,901 | $4,500 | $113,401 |
| 2016 | $1,718 | $98,197 | $4,500 | $93,697 |
| 2015 | $1,588 | $85,997 | $4,500 | $81,497 |
| 2014 | $1,361 | $75,103 | $3,870 | $71,233 |
| 2013 | -- | $59,706 | $2,400 | $57,306 |
Source: Public Records
Map
Nearby Homes
- 4808 Lee Blvd
- 4807 6th St W Unit 1
- 4908 Lee Cir N
- 206 Jack Ave N
- 404 Jack Ave N
- 702 James Ave N
- 704 John Ave N
- 705 Jack Ave N
- 4713 4th St W
- 205 James Ave N
- 4714 3rd St W
- Plan 1540 at Greenbriar - Lehigh Acres
- Plan 2010 at Greenbriar - Lehigh Acres
- Plan 2117 at Greenbriar - Lehigh Acres
- Plan 1755 at Greenbriar - Lehigh Acres
- Plan 1540 at Greenbriar
- Plan 2169 at Greenbriar - Lehigh Acres
- Plan 2169 at Greenbriar
- Plan 2117 at Greenbriar
- Plan 2265 at Greenbriar
- 4807 5th St W
- 4809 5th St W
- 4804 Lee Blvd
- 4803 5th St W
- 4806 5th St W
- 4804 5th St W
- 4808 5th St W
- 4901 Lee Cir N Unit 6
- 4800 5th St W
- 4900 Lee Cir N
- 4805 6th St W
- 4809 6th St W Unit 1
- 4900 Lee Blvd
- 4803 6th St W
- 202 James Ave N
- 204 James Ave N
- 4807 Lee Blvd
- 4904 Lee Cir N
- 4805 Lee Blvd
- 4809 Lee Blvd