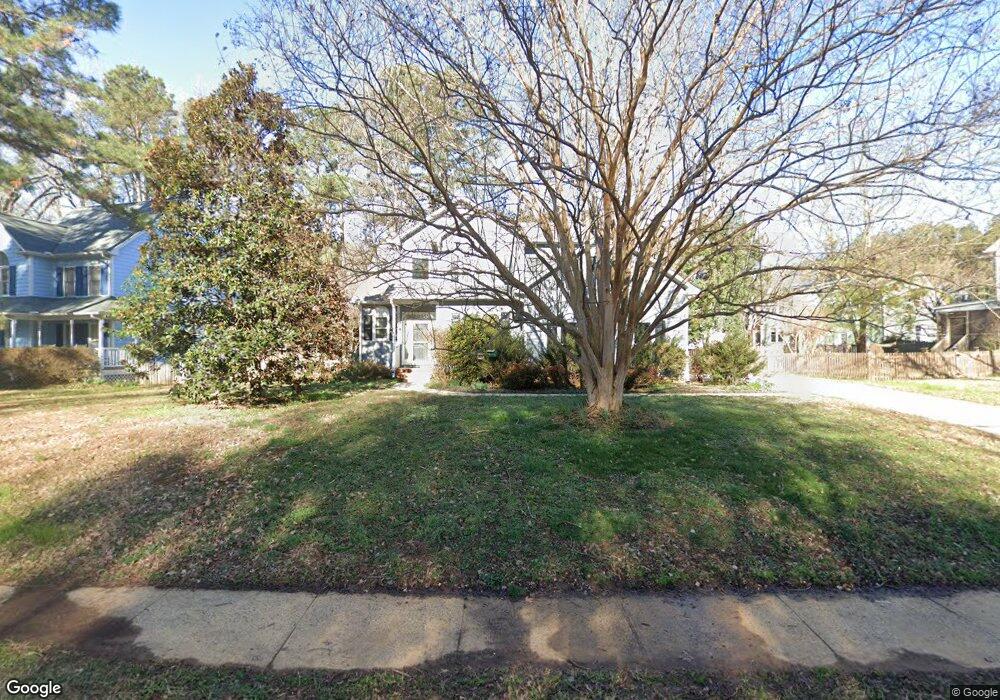
4807 American Dr Durham, NC 27705
West Durham NeighborhoodEstimated Value: $474,000 - $577,000
3
Beds
3
Baths
1,923
Sq Ft
$277/Sq Ft
Est. Value
About This Home
This home is located at 4807 American Dr, Durham, NC 27705 and is currently estimated at $532,180, approximately $276 per square foot. 4807 American Dr is a home located in Durham County with nearby schools including Morehead Montessori, Brogden Middle, and Riverside High School.
Ownership History
Date
Name
Owned For
Owner Type
Purchase Details
Closed on
Jul 7, 2014
Sold by
Mclaughlin Colleen A
Bought by
Gerken Nicola
Current Estimated Value
Home Financials for this Owner
Home Financials are based on the most recent Mortgage that was taken out on this home.
Original Mortgage
$161,900
Outstanding Balance
$123,366
Interest Rate
4.17%
Mortgage Type
New Conventional
Estimated Equity
$408,814
Purchase Details
Closed on
Mar 8, 2003
Sold by
Ziegele Eric and Ziegele Kelly
Bought by
Mclaughlin Colleen A
Home Financials for this Owner
Home Financials are based on the most recent Mortgage that was taken out on this home.
Original Mortgage
$163,600
Interest Rate
5.82%
Purchase Details
Closed on
Jun 9, 2000
Sold by
Boyapati Neeraja and Boyapati Josh Favrot
Bought by
Ziegele Eric and Ziegele Kelly
Home Financials for this Owner
Home Financials are based on the most recent Mortgage that was taken out on this home.
Original Mortgage
$165,540
Interest Rate
7.87%
Create a Home Valuation Report for This Property
The Home Valuation Report is an in-depth analysis detailing your home's value as well as a comparison with similar homes in the area
Home Values in the Area
Average Home Value in this Area
Purchase History
| Date | Buyer | Sale Price | Title Company |
|---|---|---|---|
| Gerken Nicola | $231,500 | None Available | |
| Mclaughlin Colleen A | $204,500 | -- | |
| Ziegele Eric | $186,000 | -- |
Source: Public Records
Mortgage History
| Date | Status | Borrower | Loan Amount |
|---|---|---|---|
| Open | Gerken Nicola | $161,900 | |
| Previous Owner | Mclaughlin Colleen A | $163,600 | |
| Previous Owner | Ziegele Eric | $165,540 |
Source: Public Records
Tax History Compared to Growth
Tax History
| Year | Tax Paid | Tax Assessment Tax Assessment Total Assessment is a certain percentage of the fair market value that is determined by local assessors to be the total taxable value of land and additions on the property. | Land | Improvement |
|---|---|---|---|---|
| 2025 | $5,451 | $549,834 | $130,560 | $419,274 |
| 2024 | $3,927 | $281,539 | $57,780 | $223,759 |
| 2023 | $3,688 | $281,539 | $57,780 | $223,759 |
| 2022 | $3,603 | $281,539 | $57,780 | $223,759 |
| 2021 | $3,587 | $281,539 | $57,780 | $223,759 |
| 2020 | $3,502 | $281,539 | $57,780 | $223,759 |
| 2019 | $3,502 | $281,539 | $57,780 | $223,759 |
| 2018 | $3,129 | $230,637 | $44,940 | $185,697 |
| 2017 | $3,106 | $230,637 | $44,940 | $185,697 |
| 2016 | $3,001 | $230,637 | $44,940 | $185,697 |
| 2015 | $3,002 | $216,871 | $50,209 | $166,662 |
| 2014 | $3,002 | $216,871 | $50,209 | $166,662 |
Source: Public Records
Map
Nearby Homes
- 108 Panamint Dr
- 4704 Cumberland Dr
- 28 Prestwick Place
- 37 Georgetown Ct
- 4316 American Dr
- 210 Silas St
- 123 Forest Oaks Dr
- 13 Providence Ct
- 74 Forest Oaks Dr
- 82 Forest Oaks Dr
- 4709 Stafford Dr
- 4002 Westfield Dr
- 1013 Coldspring Cir
- Townhome B Exterior Plan at Croasdaile Farm - Bronze Leaf Townhomes
- Custom Plan at Croasdaile Farm - Bronze Leaf Townhomes
- Townhome B Interior Plan at Croasdaile Farm - Bronze Leaf Townhomes
- Townhome A Exterior Plan at Croasdaile Farm - Bronze Leaf Townhomes
- Townhome A Interior Plan at Croasdaile Farm - Bronze Leaf Townhomes
- 1031 Coldspring Cir
- 24 Sunrise Place
- 4805 American Dr
- 4813 American Dr
- 4403 Cumberland Dr
- 4 Chiswell Ct
- 2 Chiswell Ct
- 4405 Cumberland Dr
- 4810 American Dr
- 4812 American Dr
- 4808 American Dr
- 4407 Cumberland Dr
- 4814 American Dr
- 6 Chiswell Ct
- 1 Wyndham Place
- 4804 American Dr
- 4402 Cumberland Dr
- 5 Chiswell Ct
- 4404 Cumberland Dr
- 4409 Cumberland Dr
- 3 Wyndham Place
- 50 Pocono Dr