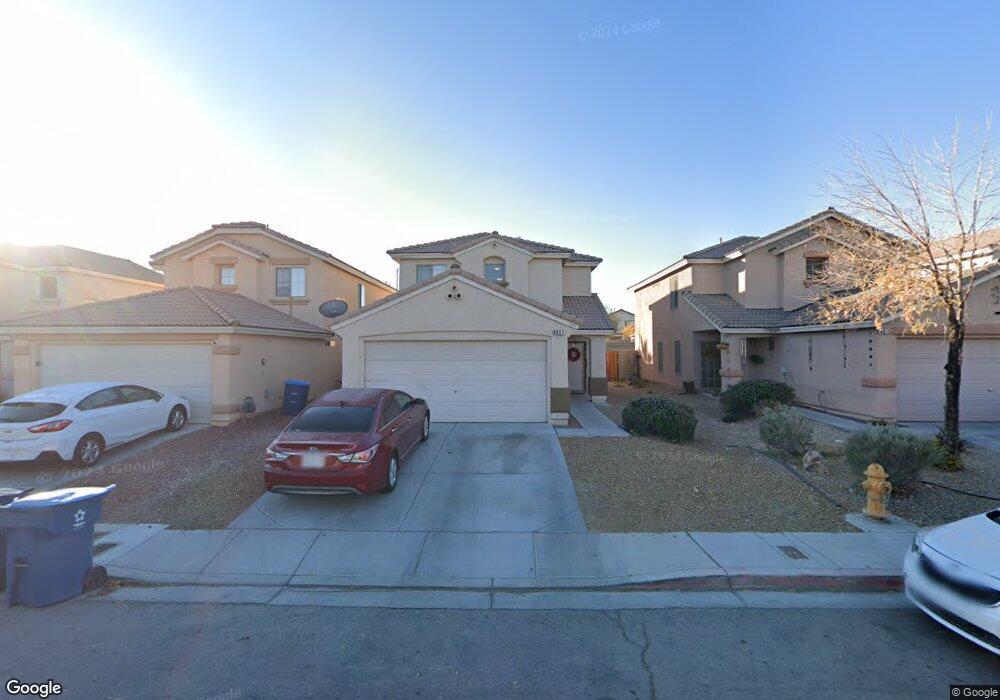
4807 Thackerville Ave Unit 1 Las Vegas, NV 89139
Coronado Ranch NeighborhoodEstimated Value: $434,000 - $454,000
5
Beds
3
Baths
1,818
Sq Ft
$245/Sq Ft
Est. Value
About This Home
This home is located at 4807 Thackerville Ave Unit 1, Las Vegas, NV 89139 and is currently estimated at $444,705, approximately $244 per square foot. 4807 Thackerville Ave Unit 1 is a home located in Clark County with nearby schools including Dr. Beverly S. Mathis Elementary School, Lawrence & Heidi Canarelli Middle School, and Desert Oasis High School.
Ownership History
Date
Name
Owned For
Owner Type
Purchase Details
Closed on
Jul 13, 2006
Sold by
Zhou Xiaoping and Zhao Yan
Bought by
Zhou Xiaoping and Zhao Yan
Current Estimated Value
Purchase Details
Closed on
Dec 22, 2003
Sold by
Masel Charles A and Masel Sharon L
Bought by
Zhou Xiaoping and Zhao Yan
Home Financials for this Owner
Home Financials are based on the most recent Mortgage that was taken out on this home.
Original Mortgage
$170,400
Outstanding Balance
$74,749
Interest Rate
5.12%
Mortgage Type
New Conventional
Estimated Equity
$369,956
Purchase Details
Closed on
Jun 10, 2002
Sold by
Woodside Homes Of Nevada Inc
Bought by
Masel Charles A and Masel Sharon L
Home Financials for this Owner
Home Financials are based on the most recent Mortgage that was taken out on this home.
Original Mortgage
$149,458
Interest Rate
6.74%
Mortgage Type
FHA
Create a Home Valuation Report for This Property
The Home Valuation Report is an in-depth analysis detailing your home's value as well as a comparison with similar homes in the area
Home Values in the Area
Average Home Value in this Area
Purchase History
| Date | Buyer | Sale Price | Title Company |
|---|---|---|---|
| Zhou Xiaoping | -- | None Available | |
| Zhou Xiaoping | $213,000 | Ticor Title Of Nevada Inc | |
| Masel Charles A | $170,834 | United Title | |
| Woodside Homes Of Nevada Inc | -- | United Title |
Source: Public Records
Mortgage History
| Date | Status | Borrower | Loan Amount |
|---|---|---|---|
| Open | Zhou Xiaoping | $170,400 | |
| Previous Owner | Masel Charles A | $149,458 |
Source: Public Records
Tax History Compared to Growth
Tax History
| Year | Tax Paid | Tax Assessment Tax Assessment Total Assessment is a certain percentage of the fair market value that is determined by local assessors to be the total taxable value of land and additions on the property. | Land | Improvement |
|---|---|---|---|---|
| 2025 | $1,726 | $106,907 | $35,000 | $71,907 |
| 2024 | $1,599 | $106,907 | $35,000 | $71,907 |
| 2023 | $1,677 | $99,338 | $31,500 | $67,838 |
| 2022 | $1,628 | $88,234 | $26,250 | $61,984 |
| 2021 | $1,507 | $81,981 | $23,100 | $58,881 |
| 2020 | $1,461 | $79,689 | $21,350 | $58,339 |
| 2019 | $1,443 | $76,330 | $18,900 | $57,430 |
| 2018 | $1,377 | $69,354 | $14,350 | $55,004 |
| 2017 | $2,054 | $70,047 | $14,350 | $55,697 |
| 2016 | $1,305 | $62,195 | $10,500 | $51,695 |
| 2015 | $1,304 | $50,596 | $8,400 | $42,196 |
| 2014 | $1,263 | $41,787 | $5,250 | $36,537 |
Source: Public Records
Map
Nearby Homes
- 4801 Pagosa Springs Dr
- 4832 Englewood Ave
- 4895 Jubilee Diamond Ct
- 4732 Lone Grove Dr
- 8175 Arville St Unit 218
- 8175 Arville St Unit 1
- 8175 Arville St Unit 142
- 8175 Arville St Unit 109
- 8175 Arville St Unit 141
- 8175 Arville St Unit 49
- 8175 Arville St Unit 319
- 8175 Arville St Unit 295
- 8175 Arville St Unit 404
- 8175 Arville St Unit 158
- 8175 Arville St Unit 13
- 8175 Arville St Unit 363
- 8175 Arville St Unit 65
- 8175 Arville St Unit 189
- 8175 Arville St Unit 190
- 8175 Arville St Unit 401
- 4815 Thackerville Ave
- 4797 Thackerville Ave
- 4823 Thackerville Ave
- 4787 Thackerville Ave
- 4777 Thackerville Ave
- 4831 Thackerville Ave Unit 1
- 4767 Thackerville Ave
- 4808 Thackerville Ave Unit 1
- 4800 Thackerville Ave Unit n/a
- 4816 Thackerville Ave
- 4790 Thackerville Ave
- 4824 Thackerville Ave
- 4757 Thackerville Ave
- 4780 Thackerville Ave
- 4832 Thackerville Ave
- 4770 Thackerville Ave
- 4770 Thackerville Ave
- 8102 Blue Hope Diamond Ln
- 4747 Thackerville Ave