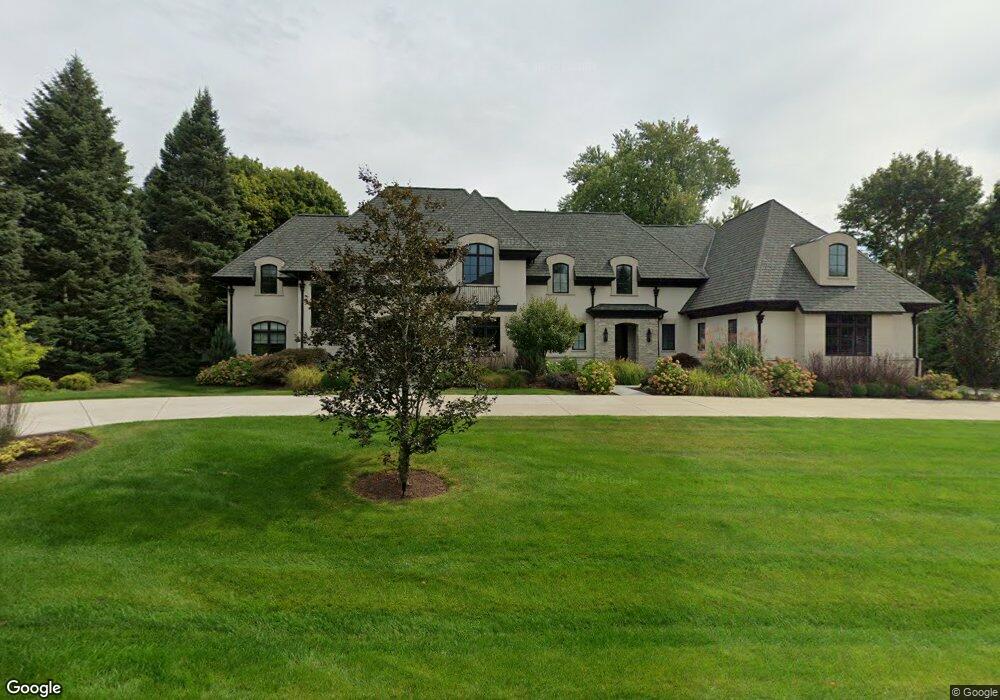
4807 Tully Rd Bloomfield Hills, MI 48302
Estimated Value: $1,422,000 - $2,346,395
4
Beds
6
Baths
5,561
Sq Ft
$347/Sq Ft
Est. Value
About This Home
This home is located at 4807 Tully Rd, Bloomfield Hills, MI 48302 and is currently estimated at $1,928,349, approximately $346 per square foot. 4807 Tully Rd is a home located in Oakland County with nearby schools including Conant Elementary School, South Hills Middle School, and Bloomfield Hills High School.
Ownership History
Date
Name
Owned For
Owner Type
Purchase Details
Closed on
Oct 27, 2021
Sold by
Goldman Jonathan B and Goldman Stefanie
Bought by
Goldman Stefanie and Goldman Jonathan
Current Estimated Value
Purchase Details
Closed on
Jun 6, 2017
Sold by
Goldman Stefanie
Bought by
Goldman Jonathan B and Goldman Stefanie
Home Financials for this Owner
Home Financials are based on the most recent Mortgage that was taken out on this home.
Original Mortgage
$1,278,400
Interest Rate
4.03%
Mortgage Type
Construction
Purchase Details
Closed on
Nov 25, 2013
Sold by
Snitz Barbara
Bought by
Zatkoff David and Lizut Marie
Purchase Details
Closed on
Jun 27, 2013
Sold by
Snitz Barbara Sue
Bought by
The Revocable Trust Of Barbara Snitz
Purchase Details
Closed on
Jun 17, 2005
Sold by
Snitz Stanley
Bought by
Snitz Barbara
Create a Home Valuation Report for This Property
The Home Valuation Report is an in-depth analysis detailing your home's value as well as a comparison with similar homes in the area
Home Values in the Area
Average Home Value in this Area
Purchase History
| Date | Buyer | Sale Price | Title Company |
|---|---|---|---|
| Goldman Stefanie | -- | Land Title | |
| Goldman Jonathan B | -- | None Available | |
| Zatkoff David | $379,000 | None Available | |
| The Revocable Trust Of Barbara Snitz | -- | None Available | |
| Snitz Barbara | -- | -- |
Source: Public Records
Mortgage History
| Date | Status | Borrower | Loan Amount |
|---|---|---|---|
| Previous Owner | Goldman Jonathan B | $1,278,400 |
Source: Public Records
Tax History Compared to Growth
Tax History
| Year | Tax Paid | Tax Assessment Tax Assessment Total Assessment is a certain percentage of the fair market value that is determined by local assessors to be the total taxable value of land and additions on the property. | Land | Improvement |
|---|---|---|---|---|
| 2024 | $16,193 | $944,980 | $0 | $0 |
| 2023 | $15,670 | $902,890 | $0 | $0 |
| 2022 | $29,448 | $789,090 | $0 | $0 |
| 2021 | $29,519 | $775,070 | $0 | $0 |
| 2020 | $14,470 | $766,560 | $0 | $0 |
| 2019 | $22,828 | $531,750 | $0 | $0 |
| 2018 | $7,963 | $163,050 | $0 | $0 |
| 2017 | $3,807 | $77,550 | $0 | $0 |
| 2016 | $3,115 | $77,550 | $0 | $0 |
| 2015 | -- | $77,550 | $0 | $0 |
| 2014 | -- | $133,780 | $0 | $0 |
| 2011 | -- | $115,000 | $0 | $0 |
Source: Public Records
Map
Nearby Homes
- 1462 Sodon Ct
- 4535 Grindley Ct
- 5148 Crest Knolls Ct
- 1715 Lone Pine Rd
- 5190 Clarendon Crest St
- 5340 Franklin Rd
- 1732 Blair House Ct
- 5361 Echo Rd
- 5008 Kings Gate Way
- 5100 Kings Gate Way
- 4123 Chimney Point Dr
- 1347 N Carillon Ct
- 00 Telegraph Rd
- 0 Telegraph Rd
- 1214 Copperwood Dr
- 5611 Priory Ln
- 5129 Woodlands Ln
- 5137 Woodlands Dr Unit 24
- 1907 Raymond Place
- 5118 Vincennes Ct
- 4765 Tully Rd
- 4855 Tully Rd
- 4794 Tully Rd
- 1516 Goddard Ct
- 1520 Lone Pine Rd
- 4725 Tully Rd
- 1556 Lone Pine Rd
- 1561 Tully Ct
- 1550 Tully Ct
- 4682 Mc Ewen Dr
- 4685 Tully Rd
- 1512 Goddard Ct
- 1574 Lone Pine Rd
- 4698 Mc Ewen Dr
- 1535 Lone Pine Rd
- 1589 Tully Ct
- 1515 Lone Pine Rd
- 4650 Mc Ewen Dr
- 1555 Lone Pine Rd Unit Bldg-Unit
- 4712 Mc Ewen Dr