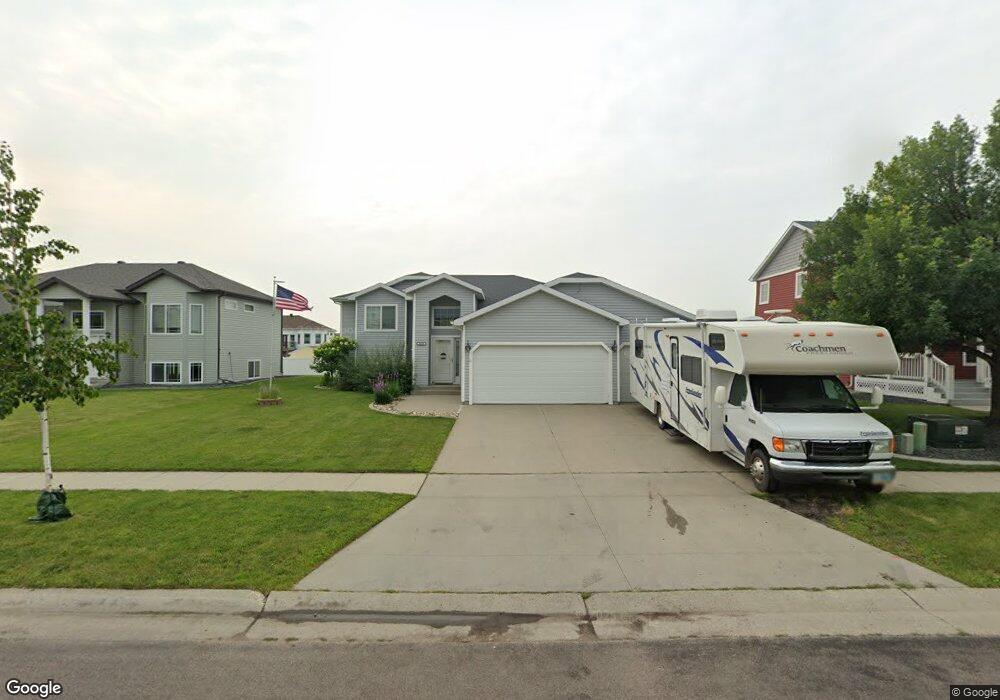
4808 48th Ave S Fargo, ND 58104
Osgood NeighborhoodEstimated Value: $351,000 - $374,194
4
Beds
3
Baths
2,227
Sq Ft
$163/Sq Ft
Est. Value
About This Home
This home is located at 4808 48th Ave S, Fargo, ND 58104 and is currently estimated at $363,799, approximately $163 per square foot. 4808 48th Ave S is a home located in Cass County with nearby schools including Osgood Elementary School, Liberty Middle School, and West Fargo Sheyenne High School.
Ownership History
Date
Name
Owned For
Owner Type
Purchase Details
Closed on
Jun 21, 2018
Sold by
Good Trevor T and Good Cassie L
Bought by
Peterson Gregory S
Current Estimated Value
Home Financials for this Owner
Home Financials are based on the most recent Mortgage that was taken out on this home.
Original Mortgage
$263,415
Outstanding Balance
$227,810
Interest Rate
4.5%
Mortgage Type
VA
Estimated Equity
$135,989
Purchase Details
Closed on
Jan 8, 2015
Sold by
Koldenhoven Michael C and Koldenhoven Cassandra J
Bought by
Good Trevor T and Good Cassie L
Home Financials for this Owner
Home Financials are based on the most recent Mortgage that was taken out on this home.
Original Mortgage
$207,000
Interest Rate
3.94%
Mortgage Type
New Conventional
Purchase Details
Closed on
Dec 2, 2008
Sold by
Jordhal Custom Homes Inc
Bought by
Koldenhoven Michael C and Koldenhoven Cassandra J
Home Financials for this Owner
Home Financials are based on the most recent Mortgage that was taken out on this home.
Original Mortgage
$160,612
Interest Rate
6.04%
Mortgage Type
FHA
Create a Home Valuation Report for This Property
The Home Valuation Report is an in-depth analysis detailing your home's value as well as a comparison with similar homes in the area
Home Values in the Area
Average Home Value in this Area
Purchase History
| Date | Buyer | Sale Price | Title Company |
|---|---|---|---|
| Peterson Gregory S | $255,000 | Trn Abstract & Title | |
| Good Trevor T | $270 | None Available | |
| Koldenhoven Michael C | -- | -- | |
| Jordahl Custom Homes Inc | -- | -- |
Source: Public Records
Mortgage History
| Date | Status | Borrower | Loan Amount |
|---|---|---|---|
| Open | Peterson Gregory S | $263,415 | |
| Previous Owner | Good Trevor T | $207,000 | |
| Previous Owner | Koldenhoven Michael C | $160,612 |
Source: Public Records
Tax History Compared to Growth
Tax History
| Year | Tax Paid | Tax Assessment Tax Assessment Total Assessment is a certain percentage of the fair market value that is determined by local assessors to be the total taxable value of land and additions on the property. | Land | Improvement |
|---|---|---|---|---|
| 2024 | $5,829 | $174,300 | $34,050 | $140,250 |
| 2023 | $5,953 | $160,700 | $34,950 | $125,750 |
| 2022 | $5,855 | $150,200 | $34,950 | $115,250 |
| 2021 | $5,464 | $133,500 | $34,950 | $98,550 |
| 2020 | $5,301 | $129,600 | $34,950 | $94,650 |
| 2019 | $5,160 | $129,600 | $21,850 | $107,750 |
| 2018 | $5,068 | $129,600 | $21,850 | $107,750 |
| 2017 | $4,846 | $124,150 | $21,850 | $102,300 |
| 2016 | $4,404 | $112,850 | $21,850 | $91,000 |
| 2015 | $4,494 | $112,850 | $14,850 | $98,000 |
| 2014 | $4,148 | $94,050 | $14,850 | $79,200 |
| 2013 | $3,897 | $87,900 | $14,850 | $73,050 |
Source: Public Records
Map
Nearby Homes
- 4820 48th Ave S
- 4761 Lavonne Ct S
- 4769 Lavonne Ct S
- 4788 48th Ave S
- 4832 48th Ave S
- 4755 Lavonne Ct S
- 4775 Lavonne Ct S
- 4829 48th Ave S
- 4845 48th Ave S
- 4844 4844 48th-Avenue-s
- 4813 48th Ave S
- 4774 48th Ave S
- 4861 48th Ave S
- 4749 Lavonne Ct S
- 4789 48th Ave S
- 4844 48th Ave S
- 4781 Lavonne Ct S
- 4766 48th Ave S
- 4743 Lavonne Ct S
- 4775 48th Ave S