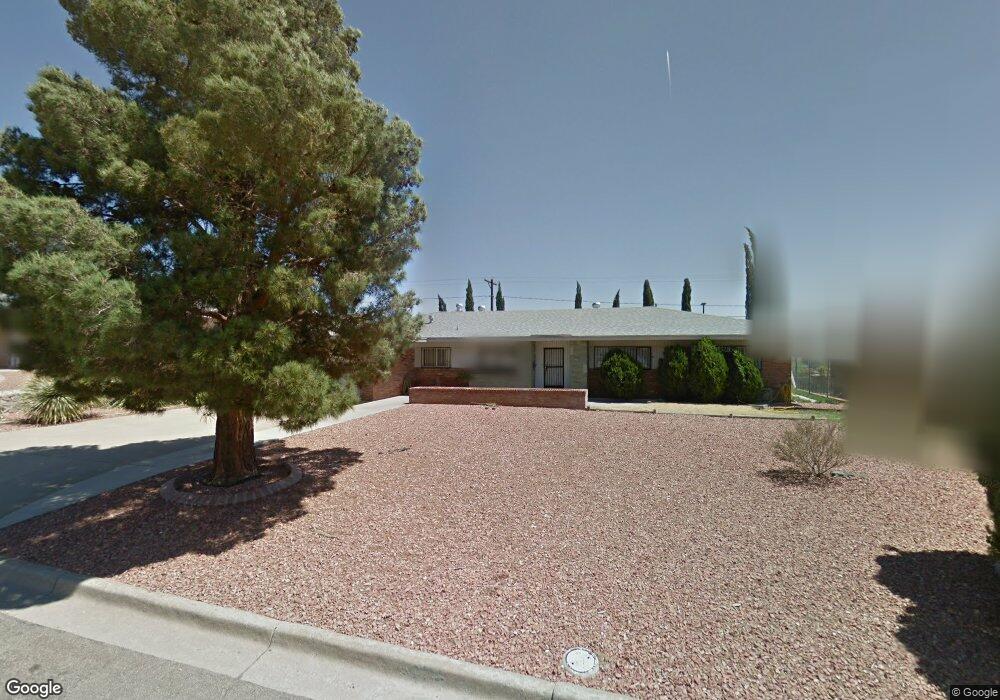
4808 Louisiana St El Paso, TX 79930
Central NeighborhoodEstimated Value: $245,000 - $320,000
3
Beds
2
Baths
2,370
Sq Ft
$121/Sq Ft
Est. Value
About This Home
This home is located at 4808 Louisiana St, El Paso, TX 79930 and is currently estimated at $287,581, approximately $121 per square foot. 4808 Louisiana St is a home located in El Paso County with nearby schools including Clendenin Elementary School, Middle School-5 NW Middle, and Austin High School.
Ownership History
Date
Name
Owned For
Owner Type
Purchase Details
Closed on
Apr 18, 2003
Sold by
Hud
Bought by
Gonzalez Mary M
Current Estimated Value
Home Financials for this Owner
Home Financials are based on the most recent Mortgage that was taken out on this home.
Original Mortgage
$101,500
Outstanding Balance
$43,027
Interest Rate
5.57%
Mortgage Type
FHA
Estimated Equity
$244,554
Purchase Details
Closed on
Nov 5, 2002
Sold by
Galceran Emilio and Galceran Sandra M
Bought by
Principal Residential Mtg Inc
Purchase Details
Closed on
Aug 4, 2000
Sold by
Gathers Merle H
Bought by
Galceran Emilio and Galceran Sandra M
Home Financials for this Owner
Home Financials are based on the most recent Mortgage that was taken out on this home.
Original Mortgage
$124,025
Interest Rate
8.21%
Mortgage Type
FHA
Purchase Details
Closed on
Jul 22, 1997
Sold by
Osborn Danny G and Osborn Carolyn M
Bought by
Gathers Merle H
Create a Home Valuation Report for This Property
The Home Valuation Report is an in-depth analysis detailing your home's value as well as a comparison with similar homes in the area
Home Values in the Area
Average Home Value in this Area
Purchase History
| Date | Buyer | Sale Price | Title Company |
|---|---|---|---|
| Gonzalez Mary M | -- | -- | |
| Principal Residential Mtg Inc | $128,676 | -- | |
| Galceran Emilio | -- | -- | |
| Gathers Merle H | -- | -- |
Source: Public Records
Mortgage History
| Date | Status | Borrower | Loan Amount |
|---|---|---|---|
| Open | Gonzalez Mary M | $101,500 | |
| Previous Owner | Galceran Emilio | $124,025 |
Source: Public Records
Tax History Compared to Growth
Tax History
| Year | Tax Paid | Tax Assessment Tax Assessment Total Assessment is a certain percentage of the fair market value that is determined by local assessors to be the total taxable value of land and additions on the property. | Land | Improvement |
|---|---|---|---|---|
| 2025 | $6,105 | $265,000 | $53,758 | $211,242 |
| 2024 | $6,105 | $240,127 | $53,758 | $186,369 |
| 2023 | $5,422 | $196,000 | $30,719 | $165,281 |
| 2022 | $4,965 | $167,729 | $30,719 | $137,010 |
| 2021 | $5,547 | $167,729 | $30,719 | $137,010 |
| 2020 | $4,962 | $161,436 | $21,942 | $139,494 |
| 2018 | $4,625 | $156,279 | $21,942 | $134,337 |
| 2017 | $4,180 | $148,389 | $21,942 | $126,447 |
| 2016 | $4,180 | $148,389 | $21,942 | $126,447 |
| 2015 | $3,044 | $148,389 | $21,942 | $126,447 |
| 2014 | $3,044 | $149,910 | $21,942 | $127,968 |
Source: Public Records
Map
Nearby Homes
- 2704 Taylor Ave
- 2801 Polk Ave
- 3010 Pierce Ave
- 3904 N Piedras St Unit A-B
- 3021 Monroe Ave
- 3104 Van Buren Ave
- 3312 Polk Ave
- 3501 Taylor Ave
- 3501 Polk Ave
- 3413 Monroe Ave
- 3423 Wickham Ave
- 3027 Morehead Ave
- 3031 Fort Blvd
- PN-258825 Tbd
- 3737 Fred Wilson Ave
- 3808 Johnson Ave
- TBD Sheppard Ave
- 3411 Leavell Ave
- 3906 Taylor Ave
- 424 Hidden Gem St
- 4804 Louisiana St
- 4812 Louisiana St
- 4815 Louisiana St
- 4805 Louisiana St
- 4800 Louisiana St
- 4820 Louisiana St
- 4819 Louisiana St
- 4801 Louisiana St
- 4900 Louisiana St
- 4708 Louisiana St
- 4715 Louisiana St
- 4901 Louisiana St
- 4904 Louisiana St
- 4704 Louisiana St
- 4905 Louisiana St
- 4705 Louisiana St
- 4908 Louisiana St
- 4700 Louisiana St
- 4911 Louisiana St
- 4701 Louisiana St