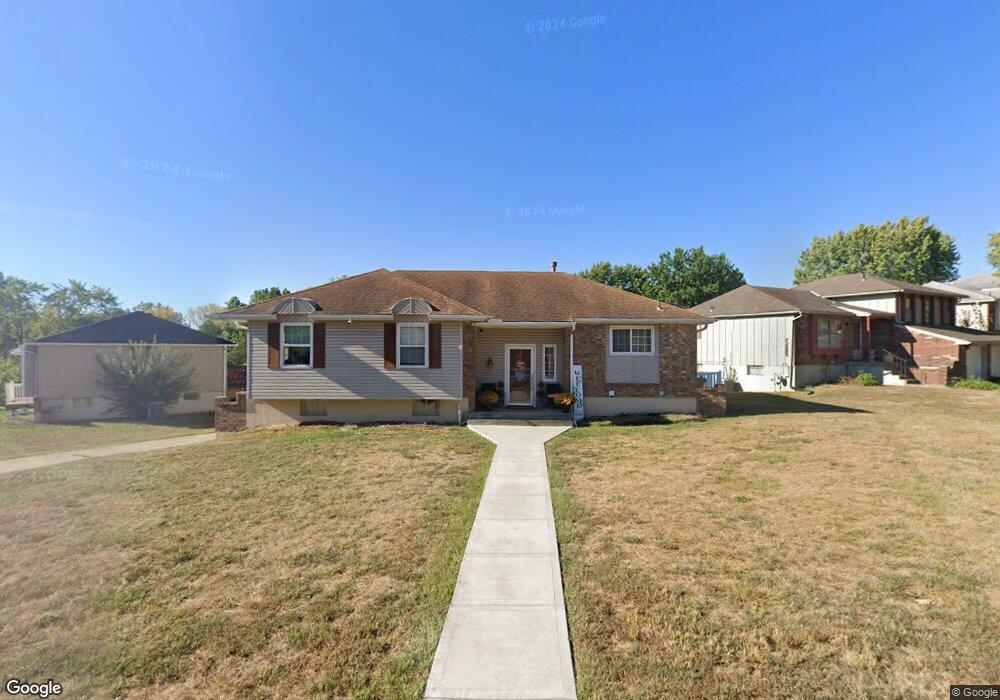
4808 NW Downing St Blue Springs, MO 64015
Estimated Value: $247,000 - $316,000
3
Beds
3
Baths
1,480
Sq Ft
$195/Sq Ft
Est. Value
About This Home
This home is located at 4808 NW Downing St, Blue Springs, MO 64015 and is currently estimated at $288,071, approximately $194 per square foot. 4808 NW Downing St is a home located in Jackson County with nearby schools including John Nowlin Elementary School, Paul Kinder Middle School, and Blue Springs High School.
Ownership History
Date
Name
Owned For
Owner Type
Purchase Details
Closed on
Feb 24, 2012
Sold by
Marrow Yolanda D and Roberts Yolanda D
Bought by
Roberts Yolanda D
Current Estimated Value
Home Financials for this Owner
Home Financials are based on the most recent Mortgage that was taken out on this home.
Original Mortgage
$142,560
Outstanding Balance
$97,855
Interest Rate
3.93%
Mortgage Type
FHA
Estimated Equity
$190,216
Purchase Details
Closed on
May 2, 2006
Sold by
Worlledge Perry V and Worlledge Selena
Bought by
Marrow Yolanda D
Purchase Details
Closed on
May 16, 2005
Sold by
Worlledge Perry V and Worlledge Selena
Bought by
Worlledge Perry V and Worlledge Selena
Home Financials for this Owner
Home Financials are based on the most recent Mortgage that was taken out on this home.
Original Mortgage
$104,000
Interest Rate
5.92%
Mortgage Type
New Conventional
Create a Home Valuation Report for This Property
The Home Valuation Report is an in-depth analysis detailing your home's value as well as a comparison with similar homes in the area
Home Values in the Area
Average Home Value in this Area
Purchase History
| Date | Buyer | Sale Price | Title Company |
|---|---|---|---|
| Roberts Yolanda D | -- | Platinum Title Llc | |
| Marrow Yolanda D | -- | Ctic | |
| Worlledge Perry V | -- | Capital Title Agency Inc |
Source: Public Records
Mortgage History
| Date | Status | Borrower | Loan Amount |
|---|---|---|---|
| Open | Roberts Yolanda D | $142,560 | |
| Previous Owner | Worlledge Perry V | $104,000 |
Source: Public Records
Tax History Compared to Growth
Tax History
| Year | Tax Paid | Tax Assessment Tax Assessment Total Assessment is a certain percentage of the fair market value that is determined by local assessors to be the total taxable value of land and additions on the property. | Land | Improvement |
|---|---|---|---|---|
| 2025 | $3,889 | $44,726 | $5,147 | $39,579 |
| 2024 | $3,814 | $47,665 | $4,885 | $42,780 |
| 2023 | $3,814 | $47,665 | $3,564 | $44,101 |
| 2022 | $3,062 | $33,820 | $4,703 | $29,117 |
| 2021 | $3,059 | $33,820 | $4,703 | $29,117 |
| 2020 | $2,728 | $30,671 | $4,703 | $25,968 |
| 2019 | $2,637 | $30,671 | $4,703 | $25,968 |
| 2018 | $891,229 | $26,277 | $3,463 | $22,814 |
| 2017 | $2,204 | $26,277 | $3,463 | $22,814 |
| 2016 | $2,204 | $24,738 | $2,850 | $21,888 |
| 2014 | $1,968 | $22,018 | $2,947 | $19,071 |
Source: Public Records
Map
Nearby Homes
- 4508 NW Valley View Rd
- 1204 NW 55th St
- 1401 NW Birdseye Ct
- 5200 NW Primrose Ct
- 5205 NW Primrose Ct
- 0 No Address Assigned By County N A Unit HMS2492165
- 1515 NW Primrose Ln
- 4301 NW Briarwood Dr
- 405 Bellemere Rd
- 14 Emerald Shore Dr
- 4012 NW Delwood Ct
- 404 Countryside Rd
- 403 Countryside Rd
- 704 NW 39th St
- 4075 SW M 7 Hwy
- 20912 E 50th Street Ct S
- 3605 NW Dogwood Dr
- 3616 NW Dogwood Dr
- 22908 E 41st Terrace S
- 27 Beach Dr
- 4900 NW Downing St
- 4821 NW Downing St
- 4817 NW Downing St
- 4901 NW Downing St
- 4813 NW Downing St
- 4809 NW Downing St
- 4904 NW Downing St
- 4905 NW Downing St
- 4805 NW Downing St
- 4905 NW Pennington Ln
- 4908 NW Downing St
- 4909 NW Pennington Ln
- 4801 NW Downing St
- 4909 NW Downing St
- 4913 NW Pennington Ln
- 4913 NW Downing St
- 4912 NW Downing St
- 4904 NW Pennington Ln
- 913 NW Downing Ct
- 4908 NW Pennington Ln