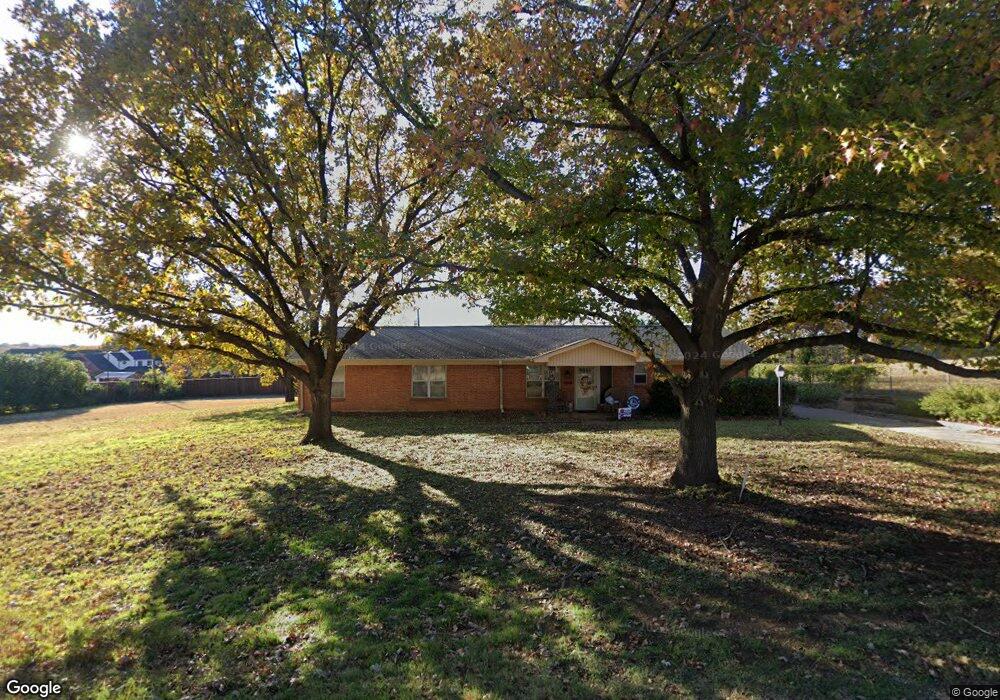
4808 Stafford Dr Colleyville, TX 76034
Estimated Value: $669,000 - $755,000
4
Beds
2
Baths
1,972
Sq Ft
$361/Sq Ft
Est. Value
About This Home
This home is located at 4808 Stafford Dr, Colleyville, TX 76034 and is currently estimated at $712,188, approximately $361 per square foot. 4808 Stafford Dr is a home located in Tarrant County with nearby schools including Bransford Elementary School, Colleyville Middle School, and Waypoint Montessori.
Ownership History
Date
Name
Owned For
Owner Type
Purchase Details
Closed on
Jul 17, 2025
Sold by
Casilio Living Trust and Casilio Jo Ellen
Bought by
Big Zig Llc
Current Estimated Value
Purchase Details
Closed on
Nov 21, 2017
Sold by
Easley Carol Ann
Bought by
Casillo Jo Ellen and The Casilio Living Trust
Home Financials for this Owner
Home Financials are based on the most recent Mortgage that was taken out on this home.
Original Mortgage
$55,560
Interest Rate
3.91%
Mortgage Type
New Conventional
Purchase Details
Closed on
Sep 9, 2014
Sold by
Linz Curtis A and Linz Mary J
Bought by
Mcdermett Brit L and Mcdermett Cindy L
Home Financials for this Owner
Home Financials are based on the most recent Mortgage that was taken out on this home.
Original Mortgage
$327,750
Interest Rate
4.15%
Mortgage Type
Purchase Money Mortgage
Create a Home Valuation Report for This Property
The Home Valuation Report is an in-depth analysis detailing your home's value as well as a comparison with similar homes in the area
Home Values in the Area
Average Home Value in this Area
Purchase History
| Date | Buyer | Sale Price | Title Company |
|---|---|---|---|
| Big Zig Llc | -- | Designated Title | |
| Casillo Jo Ellen | -- | None Available | |
| Mcdermett Brit L | -- | None Available |
Source: Public Records
Mortgage History
| Date | Status | Borrower | Loan Amount |
|---|---|---|---|
| Previous Owner | Casillo Jo Ellen | $55,560 | |
| Previous Owner | Mcdermett Brit L | $327,750 |
Source: Public Records
Tax History Compared to Growth
Tax History
| Year | Tax Paid | Tax Assessment Tax Assessment Total Assessment is a certain percentage of the fair market value that is determined by local assessors to be the total taxable value of land and additions on the property. | Land | Improvement |
|---|---|---|---|---|
| 2025 | $9,946 | $541,000 | $314,365 | $226,635 |
| 2024 | $9,946 | $558,648 | $314,365 | $244,283 |
| 2023 | $9,946 | $589,617 | $314,365 | $275,252 |
| 2022 | $8,275 | $418,991 | $314,365 | $104,626 |
| 2021 | $8,697 | $396,035 | $278,730 | $117,305 |
| 2020 | $8,800 | $396,035 | $278,730 | $117,305 |
| 2019 | $9,225 | $399,000 | $278,730 | $120,270 |
| 2018 | $2,380 | $400,284 | $181,174 | $219,110 |
| 2017 | $4,834 | $398,688 | $181,174 | $217,514 |
| 2016 | $4,394 | $303,484 | $181,174 | $122,310 |
| 2015 | $1,134 | $169,100 | $75,000 | $94,100 |
| 2014 | $1,134 | $169,100 | $75,000 | $94,100 |
Source: Public Records
Map
Nearby Homes
- 4812 Carmel Place
- 5104 Preservation Ave
- 5200 Preservation Ave
- 1104 Garry Lynne Dr
- 4600 Stafford Dr
- 1521 Four Seasons Dr
- 1505 Four Seasons Dr
- 1504 Four Seasons Dr
- 1533 Four Seasons Dr
- 1536 Four Seasons Dr
- 1513 Four Seasons Dr
- Lot 3 Amelia Ct
- 1517 Four Seasons Dr
- 1525 Four Seasons Dr
- 1532 Four Seasons Dr
- 1512 Four Seasons Dr
- 4516 Dartmoore Ln
- 4600 Westbury Dr
- 5317 Bluebonnet Dr
- 37 Piazza Ln
- 4900 Stafford Dr
- 4800 Stafford Dr
- 4809 Stafford Dr
- 1315 Glade Rd
- 1317 Glade Rd
- 4901 Stafford Dr
- 4801 Stafford Dr
- 5008 Bluebonnet Dr
- 4808 Manning Dr
- 4712 Stafford Dr
- 4800 Manning Dr
- 1416 Glade Rd
- 4713 Stafford Dr
- 1313 Glade Rd
- 1309 Glade Rd
- 1500 Glade Rd
- 4827 Carmel Place
- 4907 Carmel Place
- 4915 Carmel Place
- 4712 Manning Dr