Estimated Value: $322,000 - $371,000
--
Bed
--
Bath
1,254
Sq Ft
$273/Sq Ft
Est. Value
About This Home
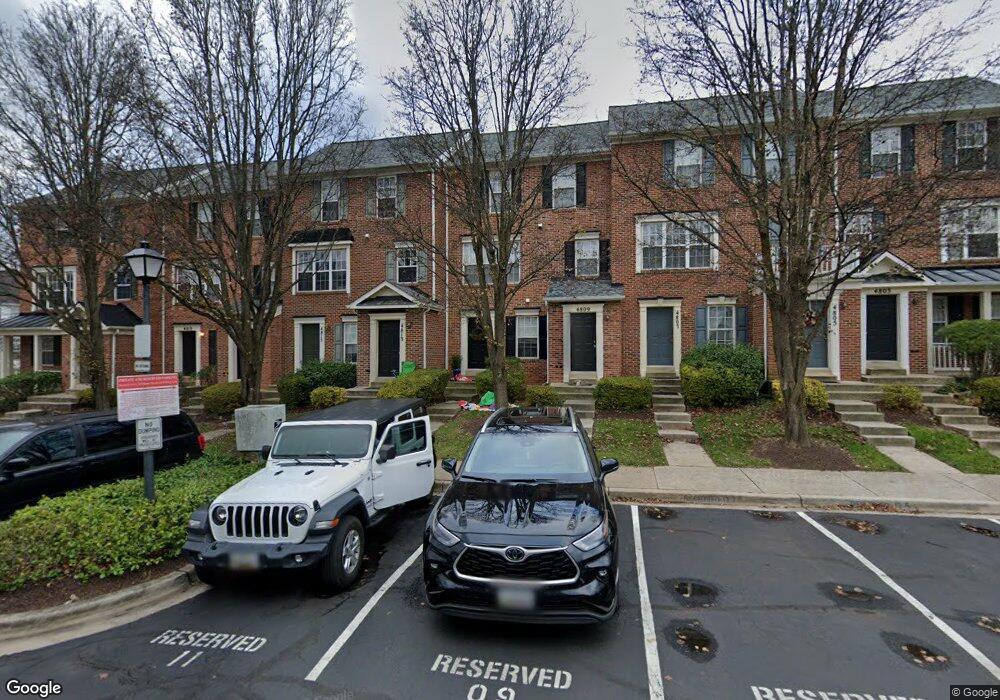
This home is located at 4809 Waltonshire Cir, Olney, MD 20832 and is currently estimated at $341,875, approximately $272 per square foot. 4809 Waltonshire Cir is a home located in Montgomery County with nearby schools including Olney Elementary School, Rosa M. Parks Middle School, and Lawrence Junior/Senior High School.
Ownership History
Date
Name
Owned For
Owner Type
Purchase Details
Closed on
Oct 11, 2024
Sold by
Abrokwa Pratt Oduro
Bought by
Abrokwa Pratt Oduro and Obeng Grace Anima
Current Estimated Value
Home Financials for this Owner
Home Financials are based on the most recent Mortgage that was taken out on this home.
Original Mortgage
$153,000
Outstanding Balance
$151,392
Interest Rate
6.35%
Mortgage Type
VA
Estimated Equity
$190,483
Purchase Details
Closed on
Aug 16, 2005
Sold by
Pratt Abrokwa
Bought by
Abrokwa Pratt O
Purchase Details
Closed on
Feb 28, 2002
Sold by
Nguyen Quan T
Bought by
Pratt Abrokwa
Purchase Details
Closed on
Mar 17, 2000
Sold by
Nguyen Quan T
Bought by
Nguyen Quan T
Purchase Details
Closed on
Dec 10, 1999
Sold by
Barnsley Llc
Bought by
Nguyen Quan T
Create a Home Valuation Report for This Property
The Home Valuation Report is an in-depth analysis detailing your home's value as well as a comparison with similar homes in the area
Home Values in the Area
Average Home Value in this Area
Purchase History
| Date | Buyer | Sale Price | Title Company |
|---|---|---|---|
| Abrokwa Pratt Oduro | -- | Radian Title Services | |
| Abrokwa Pratt Oduro | -- | Radian Title Services | |
| Abrokwa Pratt O | -- | -- | |
| Abrokwa Pratt O | -- | -- | |
| Pratt Abrokwa | $94,918 | -- | |
| Nguyen Quan T | $87,748 | -- | |
| Nguyen Quan T | $87,748 | -- |
Source: Public Records
Mortgage History
| Date | Status | Borrower | Loan Amount |
|---|---|---|---|
| Open | Abrokwa Pratt Oduro | $153,000 | |
| Closed | Abrokwa Pratt Oduro | $153,000 |
Source: Public Records
Tax History Compared to Growth
Tax History
| Year | Tax Paid | Tax Assessment Tax Assessment Total Assessment is a certain percentage of the fair market value that is determined by local assessors to be the total taxable value of land and additions on the property. | Land | Improvement |
|---|---|---|---|---|
| 2025 | $3,477 | $295,000 | $88,500 | $206,500 |
| 2024 | $3,477 | $273,333 | $0 | $0 |
| 2023 | $3,903 | $251,667 | $0 | $0 |
| 2022 | $1,854 | $230,000 | $69,000 | $161,000 |
| 2021 | $2,068 | $226,667 | $0 | $0 |
| 2020 | $2,232 | $223,333 | $0 | $0 |
| 2019 | $4,367 | $220,000 | $66,000 | $154,000 |
| 2018 | $2,180 | $220,000 | $66,000 | $154,000 |
| 2017 | $2,279 | $220,000 | $0 | $0 |
| 2016 | -- | $220,000 | $0 | $0 |
| 2015 | $2,217 | $220,000 | $0 | $0 |
| 2014 | $2,217 | $220,000 | $0 | $0 |
Source: Public Records
Map
Nearby Homes
- 4617 Weston Place
- 17 Thornhurst Ct
- 4617 Brightwood Rd
- 18700 Olney Mill Rd
- 4809 Bready Rd
- 4807 Bready Rd
- 4710 Bready Rd
- 4706 Bready Rd
- 0 Hunters Ridge Trail Unit WVHD2003230
- 4201 Briars Rd
- 18709 Ashbourne Place
- 4811 Olney Laytonsville Rd
- 4004 Briars Rd
- 0 Briars Rd
- 4008 Barnsley Ln
- 4501 Cannes Ln
- 18816 Stoneyhurst St
- 5 Roseneath Ct
- 5716 Dun Horse Ln
- 17209 Sandy Knoll Dr
- 4813 Waltonshire Cir
- 4817 Waltonshire Cir
- 4815 Waltonshire Cir
- 4805 Waltonshire Cir
- 4811 Waltonshire Cir
- 4819 Waltonshire Cir
- 4821 Waltonshire Cir
- 4803 Waltonshire Cir
- 4801 Waltonshire Cir
- 4823 Waltonshire Cir
- 4857 Waltonshire Cir
- 4855 Waltonshire Cir
- 4859 Waltonshire Cir
- 4853 Waltonshire Cir
- 4851 Waltonshire Cir
- 4806 Waltonshire Cir
- 4810 Waltonshire Cir
- 4804 Waltonshire Cir
- 4812 Waltonshire Cir
- 4802 Waltonshire Cir