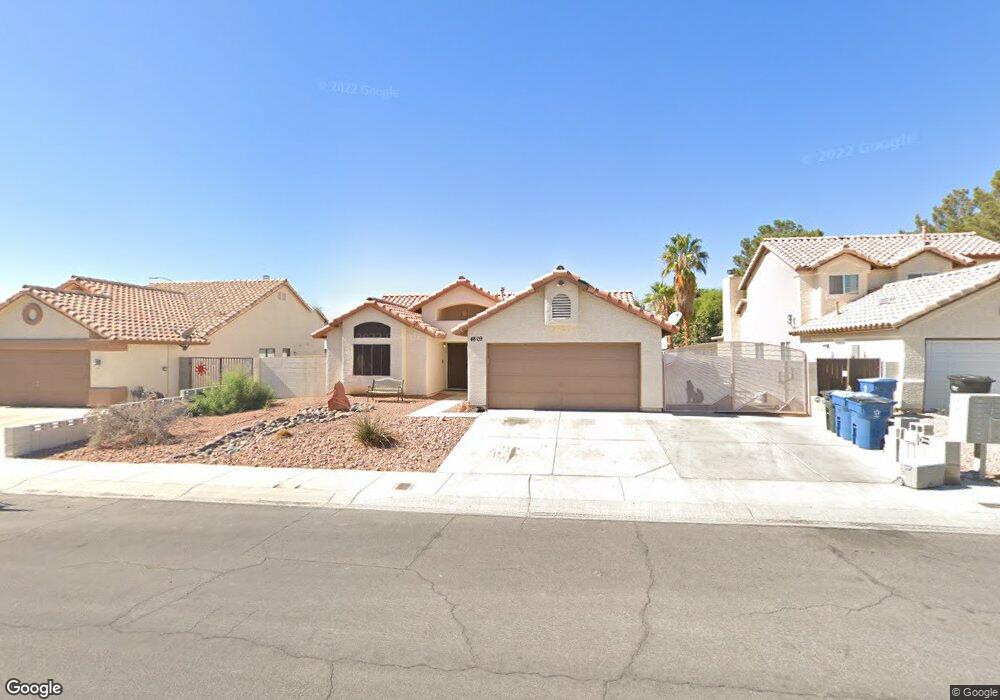
4809 Yellow Pine Ln Unit 1 Las Vegas, NV 89130
North Cheyenne NeighborhoodEstimated Value: $361,172 - $383,000
3
Beds
2
Baths
1,214
Sq Ft
$305/Sq Ft
Est. Value
About This Home
This home is located at 4809 Yellow Pine Ln Unit 1, Las Vegas, NV 89130 and is currently estimated at $370,793, approximately $305 per square foot. 4809 Yellow Pine Ln Unit 1 is a home located in Clark County with nearby schools including Ernest May Elementary School, Theron L Swainston Middle School, and Shadow Ridge High School.
Ownership History
Date
Name
Owned For
Owner Type
Purchase Details
Closed on
Dec 7, 2010
Sold by
Creevy Barry and Creevy Patricia
Bought by
Hanson Dennis R and Hanson Claudine L
Current Estimated Value
Purchase Details
Closed on
Jun 14, 2006
Sold by
Creevy Barry and Creevy Patricia
Bought by
Creevy Patricia
Home Financials for this Owner
Home Financials are based on the most recent Mortgage that was taken out on this home.
Original Mortgage
$55,000
Interest Rate
6.55%
Mortgage Type
New Conventional
Purchase Details
Closed on
Mar 29, 1997
Sold by
Gilson Don P
Bought by
Creevy Barry and Creevy Patricia
Home Financials for this Owner
Home Financials are based on the most recent Mortgage that was taken out on this home.
Original Mortgage
$92,000
Interest Rate
7.44%
Create a Home Valuation Report for This Property
The Home Valuation Report is an in-depth analysis detailing your home's value as well as a comparison with similar homes in the area
Home Values in the Area
Average Home Value in this Area
Purchase History
| Date | Buyer | Sale Price | Title Company |
|---|---|---|---|
| Hanson Dennis R | $100,000 | Chicago Title Las Vegas | |
| Creevy Patricia | -- | Accommodation | |
| Creevy Barry | -- | Accommodation | |
| Creevy Barry | -- | First American Title Co |
Source: Public Records
Mortgage History
| Date | Status | Borrower | Loan Amount |
|---|---|---|---|
| Previous Owner | Creevy Patricia | $55,000 | |
| Previous Owner | Creevy Barry | $92,000 |
Source: Public Records
Tax History Compared to Growth
Tax History
| Year | Tax Paid | Tax Assessment Tax Assessment Total Assessment is a certain percentage of the fair market value that is determined by local assessors to be the total taxable value of land and additions on the property. | Land | Improvement |
|---|---|---|---|---|
| 2025 | $1,339 | $73,182 | $33,950 | $39,232 |
| 2024 | $1,241 | $73,182 | $33,950 | $39,232 |
| 2023 | $1,241 | $71,465 | $33,600 | $37,865 |
| 2022 | $1,205 | $60,807 | $25,900 | $34,907 |
| 2021 | $1,116 | $55,865 | $22,400 | $33,465 |
| 2020 | $1,080 | $55,445 | $22,050 | $33,395 |
| 2019 | $1,067 | $51,731 | $18,550 | $33,181 |
| 2018 | $1,018 | $48,027 | $15,750 | $32,277 |
| 2017 | $1,550 | $47,296 | $14,350 | $32,946 |
| 2016 | $965 | $46,684 | $13,300 | $33,384 |
| 2015 | $964 | $37,928 | $8,750 | $29,178 |
| 2014 | $934 | $27,644 | $7,000 | $20,644 |
Source: Public Records
Map
Nearby Homes
- 4904 Pinon Dr
- 4708 English Ivy Ct
- 4800 Baffin Ct
- 4852 Maryvale Dr
- 4872 Maryvale Dr
- 5213 Tamanar Dr
- 4933 Fiesta Lakes St
- 4708 Royal Sunset Ct
- 4817 Friar Ln
- 5213 Red Glory Dr
- 4816 Fiesta Lakes St
- 4809 Braeburn Dr
- 4808 Fiesta Lakes St
- 4833 Fiesta Lakes St
- 4821 Fiesta Lakes St
- 4801 Fiesta Lakes St
- 5005 Cliffrose Dr
- 5108 Wild Marigold Dr
- 4529 Point Breeze Dr
- 5017 Cliffrose Dr
- 4813 Yellow Pine Ln
- 4805 Yellow Pine Ln
- 4808 Pinon Dr Unit 1
- 4812 Pinon Dr
- 4817 Yellow Pine Ln
- 4804 Pinon Dr
- 4804 Pinon Dr
- 4804 Pinon Dr
- 4808 Yellow Pine Ln
- 4816 Pinon Dr
- 4804 Yellow Pine Ln
- 4821 Yellow Pine Ln
- 4816 Yellow Pine Ln
- 5005 Austrian Dr
- 5009 Austrian Dr
- 4820 Pinon Dr
- 4800 Yellow Pine Ln
- 5013 Austrian Dr
- 5001 Austrian Dr
- 4809 Pinon Dr