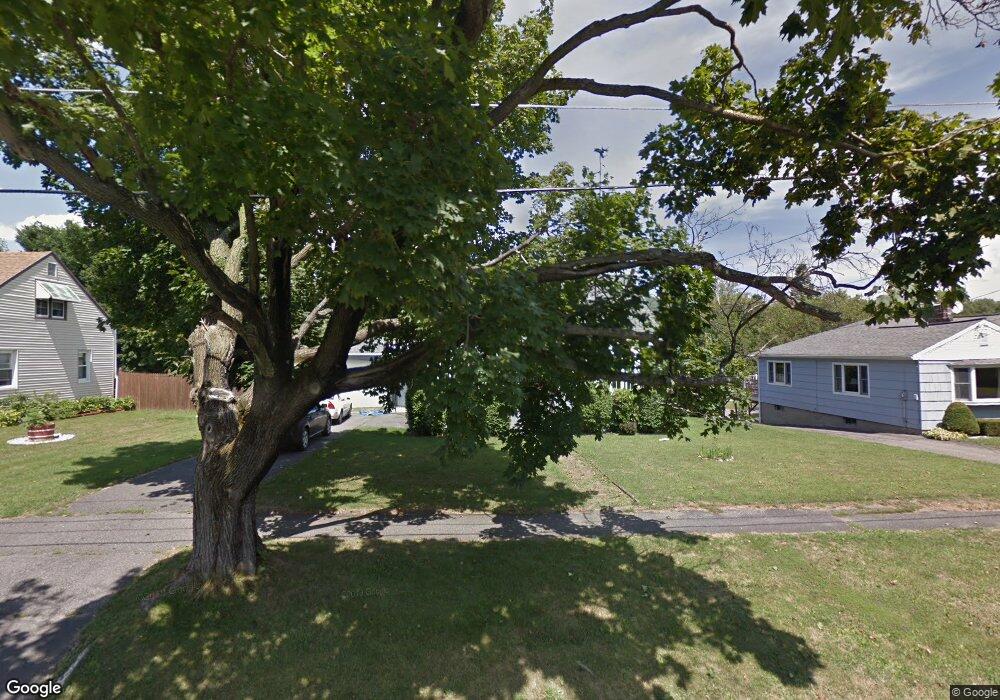
481 Barbour St North Adams, MA 01247
Estimated Value: $206,124 - $276,000
2
Beds
1
Bath
870
Sq Ft
$277/Sq Ft
Est. Value
About This Home
This home is located at 481 Barbour St, North Adams, MA 01247 and is currently estimated at $241,281, approximately $277 per square foot. 481 Barbour St is a home located in Berkshire County with nearby schools including Greylock Elementary School, Drury High School, and Pine Cobble School.
Ownership History
Date
Name
Owned For
Owner Type
Purchase Details
Closed on
Oct 2, 2009
Sold by
Keplinger Jacob C
Bought by
Gordon Jill M and Gordon Karen A
Current Estimated Value
Home Financials for this Owner
Home Financials are based on the most recent Mortgage that was taken out on this home.
Original Mortgage
$130,000
Outstanding Balance
$85,061
Interest Rate
5.12%
Mortgage Type
Purchase Money Mortgage
Estimated Equity
$156,220
Purchase Details
Closed on
Jun 19, 2008
Sold by
Gigliotti Peter A
Bought by
Keplinger Jacob C
Home Financials for this Owner
Home Financials are based on the most recent Mortgage that was taken out on this home.
Original Mortgage
$119,900
Interest Rate
6.1%
Mortgage Type
Purchase Money Mortgage
Purchase Details
Closed on
Nov 12, 2004
Sold by
Gigliotti Peter and Gigliotti Jill M
Bought by
Gigliotti Peter A
Purchase Details
Closed on
May 5, 1998
Sold by
Green Francis S and Green Jeanette C
Bought by
Gigliotti Peter A and Gigliotti Jill M
Create a Home Valuation Report for This Property
The Home Valuation Report is an in-depth analysis detailing your home's value as well as a comparison with similar homes in the area
Home Values in the Area
Average Home Value in this Area
Purchase History
| Date | Buyer | Sale Price | Title Company |
|---|---|---|---|
| Gordon Jill M | $128,000 | -- | |
| Keplinger Jacob C | $127,000 | -- | |
| Gigliotti Peter A | -- | -- | |
| Gigliotti Peter A | $71,000 | -- | |
| Gordon Jill M | $128,000 | -- | |
| Keplinger Jacob C | $127,000 | -- | |
| Gigliotti Peter A | -- | -- | |
| Gigliotti Peter A | $71,000 | -- |
Source: Public Records
Mortgage History
| Date | Status | Borrower | Loan Amount |
|---|---|---|---|
| Open | Gordon Jill M | $130,000 | |
| Closed | Gigliotti Peter A | $130,000 | |
| Previous Owner | Keplinger Jacob C | $119,900 |
Source: Public Records
Tax History Compared to Growth
Tax History
| Year | Tax Paid | Tax Assessment Tax Assessment Total Assessment is a certain percentage of the fair market value that is determined by local assessors to be the total taxable value of land and additions on the property. | Land | Improvement |
|---|---|---|---|---|
| 2025 | $3,053 | $182,700 | $45,400 | $137,300 |
| 2024 | $2,866 | $167,200 | $41,500 | $125,700 |
| 2023 | $2,765 | $156,500 | $41,500 | $115,000 |
| 2022 | $2,544 | $137,300 | $41,500 | $95,800 |
| 2021 | $2,369 | $127,300 | $38,500 | $88,800 |
| 2020 | $2,221 | $119,300 | $38,200 | $81,100 |
| 2019 | $2,094 | $109,600 | $35,300 | $74,300 |
| 2018 | $2,024 | $110,100 | $37,100 | $73,000 |
| 2017 | $1,924 | $108,900 | $36,700 | $72,200 |
| 2016 | $1,869 | $107,500 | $36,700 | $70,800 |
| 2015 | $1,794 | $107,500 | $36,700 | $70,800 |
Source: Public Records
Map
Nearby Homes
- 489 Barbour St
- 475 Barbour St
- 497 Barbour St
- 467 Barbour St
- 484 Barbour St
- 476 Barbour St
- 271 Protection Ave
- 229 Protection Ave Unit 231
- 257 Protection Ave
- 470 Barbour St
- 496 Barbour St
- 511 Barbour St
- 223 Protection Ave
- 11 Green Ave
- 20 Green Ave
- 454 Barbour St
- 521 Barbour St
- 274 Protection Ave
- 252 Protection Ave
- 19 Green Ave