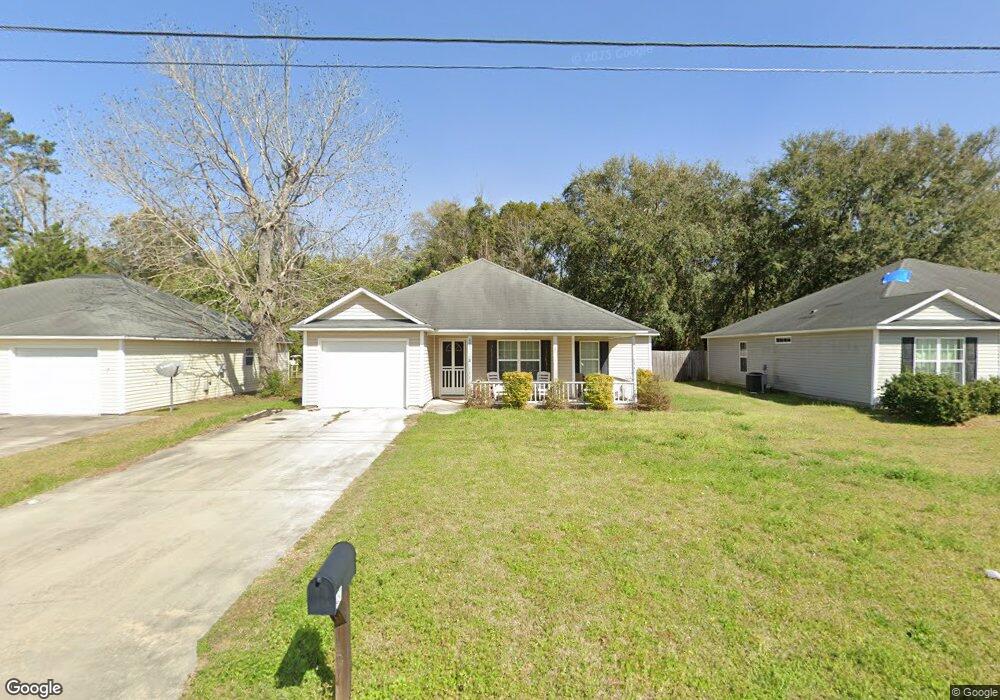
481 Bryson Cir Hahira, GA 31632
Estimated Value: $210,000 - $233,000
3
Beds
2
Baths
1,442
Sq Ft
$150/Sq Ft
Est. Value
About This Home
This home is located at 481 Bryson Cir, Hahira, GA 31632 and is currently estimated at $216,848, approximately $150 per square foot. 481 Bryson Cir is a home located in Lowndes County with nearby schools including Hahira Elementary School, Hahira Middle School, and Lowndes High School.
Ownership History
Date
Name
Owned For
Owner Type
Purchase Details
Closed on
May 5, 2021
Sold by
Littlejohn Jordan Royale
Bought by
Littlejohn Jordan Royale and Littlejohn J
Current Estimated Value
Home Financials for this Owner
Home Financials are based on the most recent Mortgage that was taken out on this home.
Original Mortgage
$142,373
Outstanding Balance
$129,025
Interest Rate
3.1%
Mortgage Type
FHA
Estimated Equity
$87,823
Purchase Details
Closed on
Jul 11, 2007
Sold by
Weaver Greg
Bought by
Baia John Anthony
Home Financials for this Owner
Home Financials are based on the most recent Mortgage that was taken out on this home.
Original Mortgage
$122,069
Interest Rate
6.71%
Mortgage Type
VA
Purchase Details
Closed on
Apr 8, 2005
Sold by
Nelco Inc
Bought by
Weaver Greg
Purchase Details
Closed on
Mar 24, 2005
Sold by
Drc Development Llc
Bought by
Nelco Inc
Create a Home Valuation Report for This Property
The Home Valuation Report is an in-depth analysis detailing your home's value as well as a comparison with similar homes in the area
Home Values in the Area
Average Home Value in this Area
Purchase History
| Date | Buyer | Sale Price | Title Company |
|---|---|---|---|
| Littlejohn Jordan Royale | -- | -- | |
| Littlejohn Jordan Royale | $145,000 | -- | |
| Baia John Anthony | $119,500 | -- | |
| Weaver Greg | $247,500 | -- | |
| Nelco Inc | $1,687,500 | -- |
Source: Public Records
Mortgage History
| Date | Status | Borrower | Loan Amount |
|---|---|---|---|
| Open | Littlejohn Jordan Royale | $142,373 | |
| Closed | Littlejohn Jordan Royale | $142,373 | |
| Previous Owner | Baia John Anthony | $122,069 |
Source: Public Records
Tax History Compared to Growth
Tax History
| Year | Tax Paid | Tax Assessment Tax Assessment Total Assessment is a certain percentage of the fair market value that is determined by local assessors to be the total taxable value of land and additions on the property. | Land | Improvement |
|---|---|---|---|---|
| 2024 | $2,089 | $76,237 | $10,000 | $66,237 |
| 2023 | $2,007 | $60,638 | $10,000 | $50,638 |
| 2022 | $1,390 | $44,641 | $10,000 | $34,641 |
| 2021 | $1,400 | $44,641 | $10,000 | $34,641 |
| 2020 | $1,394 | $43,840 | $10,000 | $33,840 |
| 2019 | $1,406 | $43,840 | $10,000 | $33,840 |
| 2018 | $1,418 | $43,840 | $10,000 | $33,840 |
| 2017 | $1,439 | $43,840 | $10,000 | $33,840 |
| 2016 | $1,442 | $43,840 | $10,000 | $33,840 |
| 2015 | $1,390 | $43,840 | $10,000 | $33,840 |
| 2014 | $1,414 | $43,840 | $10,000 | $33,840 |
Source: Public Records
Map
Nearby Homes
- 824 Danielle Way
- 489 Bryson Cir
- 497 Bryson Cir
- 819 Kristen Ln
- 3001 Houser Way
- 1601 Beverly Ln
- The Belfort Plan at Phillips Place
- The Ozark Plan at Phillips Place
- 6680 Brookridge Dr
- 411 Judy Ann Dr
- 6672 Brookridge Dr
- 605 S Nelson St
- 209 Orvis Ln
- 3033 Reynolda Dr
- 6622 Brookridge Dr
- 6628 Brookridge Dr
- 6616 Brookridge Dr
- 6610 Brookridge Dr
- The Walker Plan at Reynolda Place
- The Belfort Plan at Reynolda Place
- 485 Bryson Cir
- 477 Bryson Cir
- 480 Bryson Cir
- 484 Bryson Cir
- 476 Bryson Cir
- 473 Bryson Cir
- 493 Bryson Cir
- 488 Bryson Cir
- 469 Bryson Cir
- 460 Bryson Cir
- 492 Bryson Cir
- 813 Danielle Way
- 465 Bryson Cir
- 465 Bryson Cir
- 817 Danielle Way
- 807 Danielle Way
- 496 Bryson Cir
- 821 Danielle Way
- 113 Puett Dr
- 803 Danielle Way