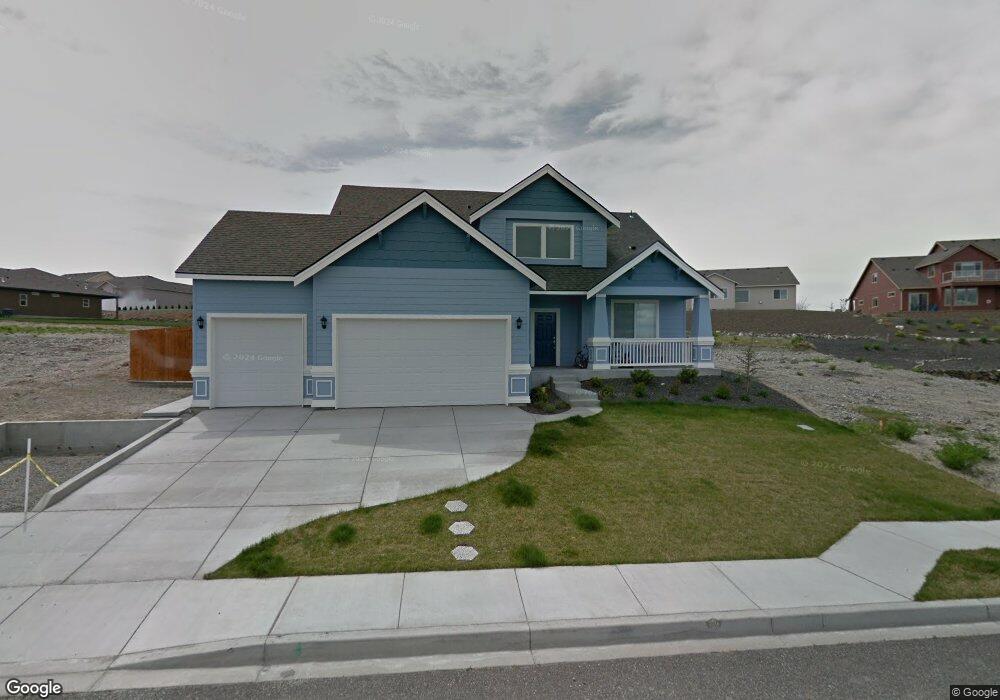
481 Charbonneau Dr Richland, WA 99352
Estimated Value: $544,000 - $583,000
4
Beds
3
Baths
2,782
Sq Ft
$204/Sq Ft
Est. Value
About This Home
This home is located at 481 Charbonneau Dr, Richland, WA 99352 and is currently estimated at $567,311, approximately $203 per square foot. 481 Charbonneau Dr is a home located in Benton County with nearby schools including Badger Mountain Elementary School, Carmichael Middle School, and Richland High School.
Ownership History
Date
Name
Owned For
Owner Type
Purchase Details
Closed on
Aug 26, 2011
Sold by
Mercer Construction Inc
Bought by
Vanden Dikkenberg Marc E and Van Den Dikkenberg Analiese D
Current Estimated Value
Home Financials for this Owner
Home Financials are based on the most recent Mortgage that was taken out on this home.
Original Mortgage
$287,305
Outstanding Balance
$193,041
Interest Rate
3.87%
Mortgage Type
Adjustable Rate Mortgage/ARM
Estimated Equity
$374,270
Purchase Details
Closed on
Jun 2, 2011
Sold by
River View Pointe Llc
Bought by
Mercer Construction Inc
Home Financials for this Owner
Home Financials are based on the most recent Mortgage that was taken out on this home.
Original Mortgage
$3,000,000
Interest Rate
4.73%
Mortgage Type
Purchase Money Mortgage
Purchase Details
Closed on
Nov 30, 2006
Sold by
Mercer Construction Inc
Bought by
River View Pointe Llc
Purchase Details
Closed on
Dec 14, 2005
Sold by
River View Pointe Llc
Bought by
Mercer Construction Inc
Create a Home Valuation Report for This Property
The Home Valuation Report is an in-depth analysis detailing your home's value as well as a comparison with similar homes in the area
Home Values in the Area
Average Home Value in this Area
Purchase History
| Date | Buyer | Sale Price | Title Company |
|---|---|---|---|
| Vanden Dikkenberg Marc E | $302,428 | Chicago Title | |
| Mercer Construction Inc | -- | Chicago Title | |
| River View Pointe Llc | -- | None Available | |
| Mercer Construction Inc | -- | Chicago Title |
Source: Public Records
Mortgage History
| Date | Status | Borrower | Loan Amount |
|---|---|---|---|
| Open | Vanden Dikkenberg Marc E | $287,305 | |
| Previous Owner | Mercer Construction Inc | $3,000,000 |
Source: Public Records
Tax History Compared to Growth
Tax History
| Year | Tax Paid | Tax Assessment Tax Assessment Total Assessment is a certain percentage of the fair market value that is determined by local assessors to be the total taxable value of land and additions on the property. | Land | Improvement |
|---|---|---|---|---|
| 2024 | $4,809 | $550,960 | $50,000 | $500,960 |
| 2023 | $4,809 | $515,170 | $50,000 | $465,170 |
| 2022 | $4,248 | $431,680 | $50,000 | $381,680 |
| 2021 | $4,018 | $383,970 | $50,000 | $333,970 |
| 2020 | $4,507 | $348,190 | $50,000 | $298,190 |
| 2019 | $3,563 | $369,650 | $46,200 | $323,450 |
| 2018 | $3,654 | $313,880 | $46,200 | $267,680 |
| 2017 | $3,225 | $269,270 | $46,200 | $223,070 |
| 2016 | $3,616 | $269,270 | $46,200 | $223,070 |
| 2015 | $3,667 | $269,270 | $46,200 | $223,070 |
| 2014 | -- | $269,270 | $46,200 | $223,070 |
| 2013 | -- | $269,270 | $46,200 | $223,070 |
Source: Public Records
Map
Nearby Homes
- 1443 Desert Springs Ave
- 1433 Rimrock Ave
- 511 Cherokee St
- 507 Cherokee St
- 2467 N Rhode Island Ct
- 2105 N Steptoe St Unit 50
- 2105 N Steptoe St Unit 119
- 1593 Lantana Ave
- 1606 Lantana Ave
- 2327 N Rhode Island St
- 1641 Foxglove Ave
- 1547 Tieton Ct
- 9139 W Arrowhead Ave
- 1606 Amon Dr
- 100 Hills Way W
- 8700 W Bonnie Ave
- 0 Tapteal Dr
- 2101 N Pittsburg Ct
- 1428 Short St
- 1330 Louisiana Ave
- 477 Charbonneau Dr
- 477 Charbonneau Dr Unit 3Bdr ,Bonus or DEN,
- 489 Charbonneau Dr
- 434 Satus St
- 469 Charbonneau Dr
- 440 Satus St
- 480 Charbonneau Dr Unit PRIVATE BACKYARD, S
- 480 Charbonneau Dr Unit Spacious home in pri
- 480 Charbonneau Dr
- 488 Charbonneau Dr Unit VIEW OF COLUMBIA RIV
- 488 Charbonneau Dr Unit "Huge Price Reductio
- 488 Charbonneau Dr
- 497 Charbonneau Dr
- 474 Charbonneau Dr
- 474 Charbonneau Dr Unit Kitchen granite & la
- 446 Satus St
- 498 Charbonneau Dr
- 461 Charbonneau Dr
- 501 Charbonneau Dr
- 466 Charbonneau Dr