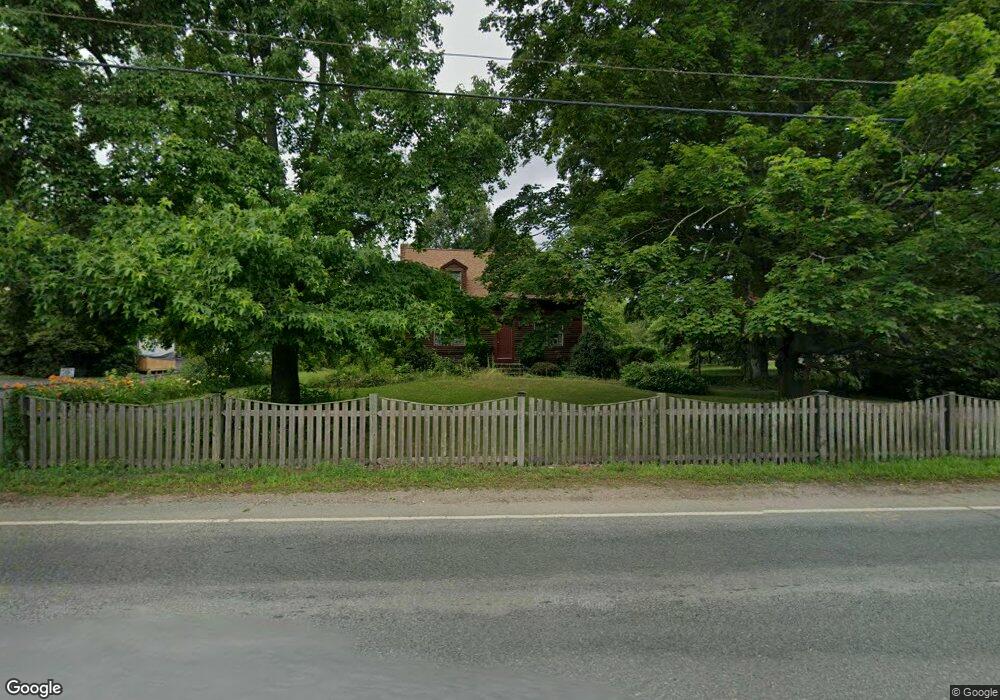
481 E Center St West Bridgewater, MA 02379
Estimated Value: $571,680 - $671,000
About This Home
This home is located at 481 E Center St, West Bridgewater, MA 02379 and is currently estimated at $613,920, approximately $389 per square foot. 481 E Center St is a home located in Plymouth County with nearby schools including Spring Street Elementary School, Howard Elementary School, and Rose L. MacDonald Elementary School.
Ownership History
We collect this data history from publicly available records. To have your information removed, we recommend requesting removal directly through your county’s website.
Purchase Details
Purchase Details
Home Values in the Area
Average Home Value in this Area
Purchase History
We collect this data history from publicly available records. To have your information removed, we recommend requesting removal directly through your county’s website.
| Date | Buyer | Sale Price | Title Company |
|---|---|---|---|
| -- | -- | ||
| -- | -- |
Mortgage History
We collect this data history from publicly available records. To have your information removed, we recommend requesting removal directly through your county’s website.
| Date | Status | Borrower | Loan Amount |
|---|---|---|---|
| Previous Owner | $50,000 | ||
| Previous Owner | $30,000 |
Tax History
We collect this data history from publicly available records. To have your information removed, we recommend requesting removal directly through your county’s website.
| Year | Tax Paid | Tax Assessment Tax Assessment Total Assessment is a certain percentage of the fair market value that is determined by local assessors to be the total taxable value of land and additions on the property. | Land | Improvement |
|---|---|---|---|---|
| 2025 | $6,585 | $481,700 | $258,300 | $223,400 |
| 2024 | $6,151 | $434,100 | $236,600 | $197,500 |
| 2023 | $5,735 | $373,100 | $204,100 | $169,000 |
| 2022 | $5,486 | $338,200 | $193,200 | $145,000 |
| 2021 | $1,509 | $327,600 | $193,200 | $134,400 |
| 2020 | $5,363 | $327,600 | $193,200 | $134,400 |
| 2019 | $1,566 | $325,000 | $193,200 | $131,800 |
| 2018 | $13,854 | $309,800 | $184,500 | $125,300 |
| 2017 | $5,993 | $290,600 | $169,200 | $121,400 |
| 2016 | $5,042 | $280,100 | $158,700 | $121,400 |
| 2015 | $4,753 | $266,900 | $158,700 | $108,200 |
| 2014 | $4,358 | $264,300 | $158,700 | $105,600 |
Map
- 455 East St
- 18 Captain Carlson Way Unit 18
- 31 Captain Carlson Way Unit 31
- 87 Union St
- 492 N Central St
- 452 N Central St
- 208 Matfield St
- 38 West St
- 20 Church Ave
- 625 Bedford St
- 48 Wall St
- 541 Bedford St
- 229 Comfort St
- 630 Main St
- 126 N Central St
- 580 Broad St Unit 2
- 580 Broad St Unit 1
- 7 Autumn Way
- 1 Daniel Terrace
- 179 Rowayne Park
- 479 E Center St
- 482 E Center St
- 482 E Center St Unit 3
- 482 E Center St Unit 1
- 465 E Center St
- 494 E Center St
- 579 West St
- 500 E Center St
- 5 Gods Way
- 3 Gods Way
- 453 E Center St
- 450 E Center St
- 283 Laurel St
- 441 E Center St
- 269 Laurel St
- 245 Laurel St
- 245 Laurel St
- 558 West St
- 438 E Center St
- 251 Laurel St
Ask me questions while you tour the home.