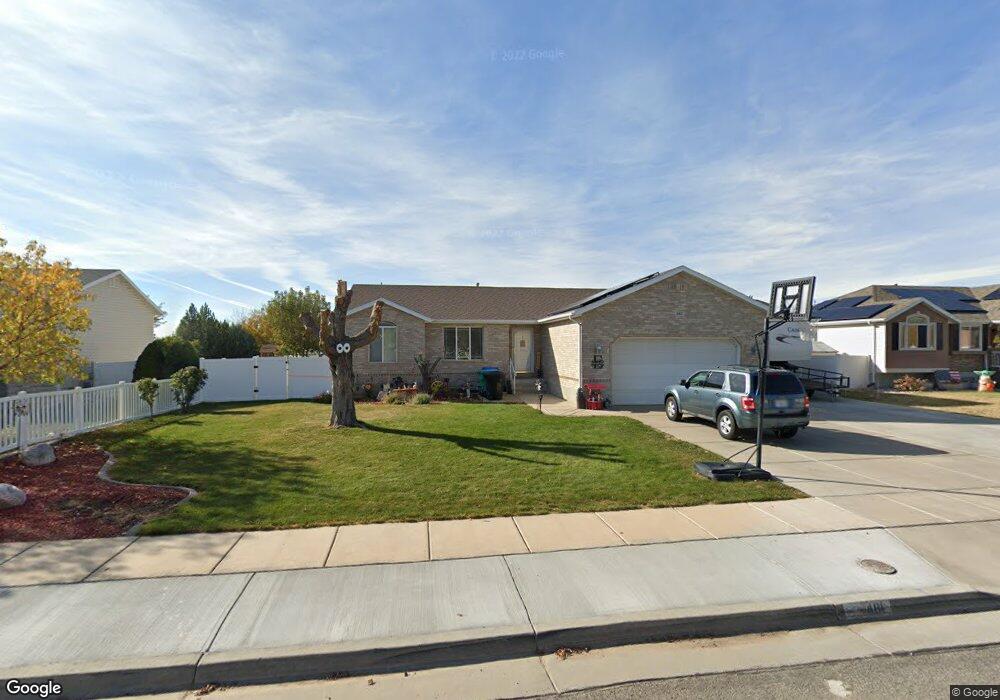
481 N 1750 W Clearfield, UT 84015
Estimated Value: $552,847 - $578,000
6
Beds
3
Baths
2,911
Sq Ft
$193/Sq Ft
Est. Value
About This Home
This home is located at 481 N 1750 W, Clearfield, UT 84015 and is currently estimated at $561,212, approximately $192 per square foot. 481 N 1750 W is a home located in Davis County with nearby schools including Lakeside School, West Point Junior High School, and Syracuse High School.
Ownership History
Date
Name
Owned For
Owner Type
Purchase Details
Closed on
Apr 8, 2020
Sold by
Edwards Don and Edwards Sandra W
Bought by
Edwards Don and Edwards Sandra
Current Estimated Value
Purchase Details
Closed on
Apr 7, 2016
Sold by
Linares Carlos R and Gonzalez Maria R
Bought by
Edwards Don and Edwards Sandra W
Purchase Details
Closed on
Mar 23, 2006
Sold by
Taylor Zachary and Taylor Valena
Bought by
Linares Carlos Rene and Gonzalez Maria Roxana
Home Financials for this Owner
Home Financials are based on the most recent Mortgage that was taken out on this home.
Original Mortgage
$195,000
Interest Rate
6.18%
Mortgage Type
Fannie Mae Freddie Mac
Purchase Details
Closed on
Apr 16, 2002
Sold by
A & J Homes Llc
Bought by
Taylor Zachary and Taylor Valena
Home Financials for this Owner
Home Financials are based on the most recent Mortgage that was taken out on this home.
Original Mortgage
$138,850
Interest Rate
6.87%
Create a Home Valuation Report for This Property
The Home Valuation Report is an in-depth analysis detailing your home's value as well as a comparison with similar homes in the area
Home Values in the Area
Average Home Value in this Area
Purchase History
| Date | Buyer | Sale Price | Title Company |
|---|---|---|---|
| Edwards Don | -- | None Available | |
| Edwards Don | -- | Backman Title | |
| Linares Carlos Rene | -- | Bonneville Title Company | |
| Taylor Zachary | -- | Equity Title Agency |
Source: Public Records
Mortgage History
| Date | Status | Borrower | Loan Amount |
|---|---|---|---|
| Previous Owner | Linares Carlos Rene | $195,000 | |
| Previous Owner | Taylor Zachary | $138,850 |
Source: Public Records
Tax History Compared to Growth
Tax History
| Year | Tax Paid | Tax Assessment Tax Assessment Total Assessment is a certain percentage of the fair market value that is determined by local assessors to be the total taxable value of land and additions on the property. | Land | Improvement |
|---|---|---|---|---|
| 2025 | $3,093 | $289,850 | $101,834 | $188,016 |
| 2024 | $2,933 | $276,101 | $91,735 | $184,366 |
| 2023 | $2,720 | $471,000 | $111,129 | $359,871 |
| 2022 | $2,936 | $278,300 | $56,928 | $221,372 |
| 2021 | $2,687 | $381,000 | $92,388 | $288,612 |
| 2020 | $2,323 | $325,000 | $76,978 | $248,022 |
| 2019 | $2,399 | $331,000 | $74,872 | $256,128 |
| 2018 | $2,169 | $295,000 | $76,283 | $218,717 |
| 2016 | $1,894 | $135,520 | $29,454 | $106,066 |
| 2015 | $1,875 | $127,105 | $29,454 | $97,651 |
| 2014 | $1,696 | $116,583 | $29,454 | $87,129 |
| 2013 | -- | $107,240 | $32,175 | $75,065 |
Source: Public Records
Map
Nearby Homes
- 1774 W 400 N
- 1652 W 560 N
- 1805 W 675 N
- 607 N 2000 W
- 1832 W 725 N
- 1827 W 775 N
- 575 N 1350 W Unit 137
- 1350 W 300 N Unit 49
- 1350 W 300 N Unit 38
- 1350 W 300 N Unit 29
- 563 N 1350 W Unit 139
- 47 N 1750 W
- 1337 W 550 N Unit 195
- 2132 W 800 N
- 12 N 2000 W Unit 1
- 2283 W 470 N
- 423 N 1250 W Unit 118
- 1828 W 75 S
- 1648 W 150 S
- 417 N 1200 W Unit 84
- 495 N 1750 W
- 443 N 1750 W
- 1761 W 500 N
- 490 N 1750 W Unit Lot 18
- 1736 W 475 N
- 427 N 1750 W
- 509 N 1750 W
- 1766 W 500 N
- 1773 W 500 N
- 1737 W 475 N Unit 15
- 438 N 1750 W
- 438 N 1750 W Unit Lot 15
- 1735 W 525 N
- 1784 W 400 N
- 411 N 1750 W
- 411 N 1750 W Unit LOT28
- 1772 W 500 N
- 1763 W 525 N
- 523 N 1750 W
- 1721 W 475 N