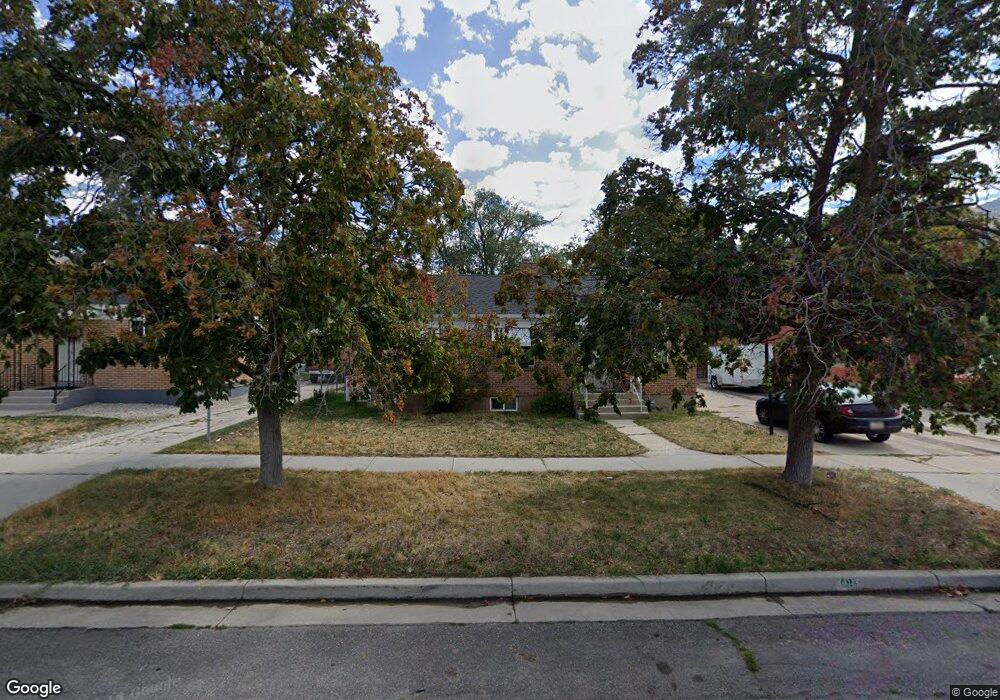
481 S 100 E Brigham City, UT 84302
Estimated Value: $345,000 - $366,378
4
Beds
2
Baths
1,800
Sq Ft
$198/Sq Ft
Est. Value
About This Home
This home is located at 481 S 100 E, Brigham City, UT 84302 and is currently estimated at $356,095, approximately $197 per square foot. 481 S 100 E is a home located in Box Elder County with nearby schools including Golden Spike Elementary, Box Elder Middle School, and Adele C. Young Intermediate School.
Ownership History
Date
Name
Owned For
Owner Type
Purchase Details
Closed on
May 30, 2024
Sold by
Hunt Preston Donavan and Gibson Brooke Lois
Bought by
Lindholm Douglas E
Current Estimated Value
Home Financials for this Owner
Home Financials are based on the most recent Mortgage that was taken out on this home.
Original Mortgage
$351,515
Outstanding Balance
$347,097
Interest Rate
7.1%
Mortgage Type
FHA
Estimated Equity
$8,998
Purchase Details
Closed on
Oct 25, 2021
Sold by
Broersma Dorothy J
Bought by
Hunt Preston Donavan and Gibson Brooke Lois
Home Financials for this Owner
Home Financials are based on the most recent Mortgage that was taken out on this home.
Original Mortgage
$252,790
Interest Rate
2.8%
Mortgage Type
New Conventional
Purchase Details
Closed on
Jun 26, 2020
Sold by
Broersma James F
Bought by
Broersma Dorothy J
Create a Home Valuation Report for This Property
The Home Valuation Report is an in-depth analysis detailing your home's value as well as a comparison with similar homes in the area
Purchase History
| Date | Buyer | Sale Price | Title Company |
|---|---|---|---|
| Lindholm Douglas E | -- | Northern Title | |
| Hunt Preston Donavan | -- | Phillips Hansen Land Title | |
| Broersma Dorothy J | -- | None Available |
Source: Public Records
Mortgage History
| Date | Status | Borrower | Loan Amount |
|---|---|---|---|
| Open | Lindholm Douglas E | $351,515 | |
| Previous Owner | Hunt Preston Donavan | $252,790 |
Source: Public Records
Tax History
| Year | Tax Paid | Tax Assessment Tax Assessment Total Assessment is a certain percentage of the fair market value that is determined by local assessors to be the total taxable value of land and additions on the property. | Land | Improvement |
|---|---|---|---|---|
| 2025 | $1,936 | $332,875 | $104,000 | $228,875 |
| 2024 | $1,697 | $326,729 | $99,000 | $227,729 |
| 2023 | $1,730 | $340,998 | $94,000 | $246,998 |
| 2022 | $1,757 | $177,070 | $21,450 | $155,620 |
| 2021 | $1,346 | $199,030 | $39,000 | $160,030 |
| 2020 | $1,225 | $199,030 | $39,000 | $160,030 |
| 2019 | $1,149 | $99,340 | $21,450 | $77,890 |
| 2018 | $1,038 | $89,181 | $21,450 | $67,731 |
| 2017 | $717 | $106,727 | $16,500 | $76,727 |
| 2016 | $753 | $56,690 | $16,500 | $40,190 |
| 2015 | $708 | $53,037 | $16,500 | $36,537 |
| 2014 | $708 | $51,297 | $16,500 | $34,797 |
| 2013 | -- | $51,297 | $16,500 | $34,797 |
Source: Public Records
Map
Nearby Homes
Your Personal Tour Guide
Ask me questions while you tour the home.