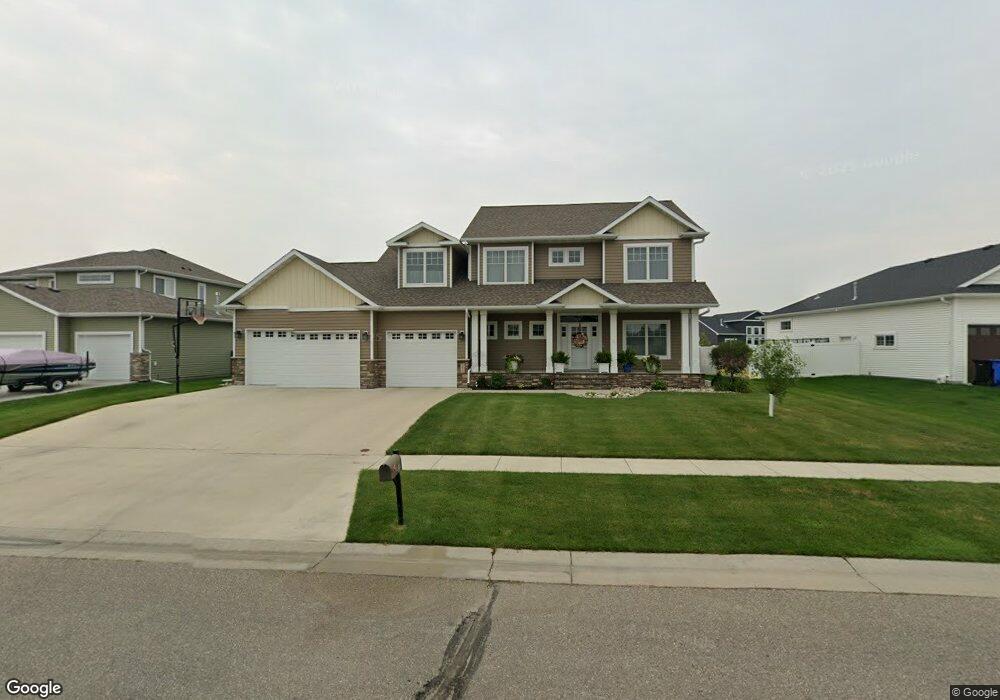
4810 41st St S Fargo, ND 58104
Woodhaven NeighborhoodEstimated Value: $690,000 - $722,768
4
Beds
3
Baths
4,510
Sq Ft
$157/Sq Ft
Est. Value
About This Home
This home is located at 4810 41st St S, Fargo, ND 58104 and is currently estimated at $709,192, approximately $157 per square foot. 4810 41st St S is a home located in Cass County with nearby schools including Kennedy Elementary School, Discovery Middle School, and Fargo Davies High School.
Ownership History
Date
Name
Owned For
Owner Type
Purchase Details
Closed on
Jan 28, 2022
Sold by
Gulland-Nelson Andy J and Gulland-Nelson Lisa M
Bought by
Bixby Daniel W and Bixby Brenda L
Current Estimated Value
Home Financials for this Owner
Home Financials are based on the most recent Mortgage that was taken out on this home.
Original Mortgage
$425,925
Outstanding Balance
$393,894
Interest Rate
3.22%
Mortgage Type
New Conventional
Estimated Equity
$315,298
Purchase Details
Closed on
Sep 29, 2017
Sold by
Titan Hmes Inc
Bought by
Gulland Nelson Andy J and Gulland Nelson Lisa M
Home Financials for this Owner
Home Financials are based on the most recent Mortgage that was taken out on this home.
Original Mortgage
$412,572
Interest Rate
3.89%
Mortgage Type
New Conventional
Purchase Details
Closed on
May 12, 2017
Sold by
Cottagewood Llc
Bought by
Titan Homes Inc
Home Financials for this Owner
Home Financials are based on the most recent Mortgage that was taken out on this home.
Original Mortgage
$245,000
Interest Rate
4.1%
Mortgage Type
Construction
Create a Home Valuation Report for This Property
The Home Valuation Report is an in-depth analysis detailing your home's value as well as a comparison with similar homes in the area
Home Values in the Area
Average Home Value in this Area
Purchase History
| Date | Buyer | Sale Price | Title Company |
|---|---|---|---|
| Bixby Daniel W | -- | New Title Company Name | |
| Bixby Daniel W | $567,900 | New Title Company Name | |
| Gulland Nelson Andy J | $516,928 | None Available | |
| Titan Homes Inc | $44,900 | Title Co | |
| Cottagewood Llc | $44,900 | Title Co |
Source: Public Records
Mortgage History
| Date | Status | Borrower | Loan Amount |
|---|---|---|---|
| Open | Bixby Daniel W | $425,925 | |
| Closed | Bixby Daniel W | $425,925 | |
| Previous Owner | Gulland Nelson Andy J | $412,572 | |
| Previous Owner | Titan Homes Inc | $245,000 |
Source: Public Records
Tax History Compared to Growth
Tax History
| Year | Tax Paid | Tax Assessment Tax Assessment Total Assessment is a certain percentage of the fair market value that is determined by local assessors to be the total taxable value of land and additions on the property. | Land | Improvement |
|---|---|---|---|---|
| 2024 | $11,871 | $331,250 | $41,150 | $290,100 |
| 2023 | $11,249 | $292,400 | $43,700 | $248,700 |
| 2022 | $10,873 | $273,250 | $43,700 | $229,550 |
| 2021 | $10,766 | $273,250 | $43,700 | $229,550 |
| 2020 | $10,728 | $273,250 | $43,700 | $229,550 |
| 2019 | $8,762 | $198,250 | $27,300 | $170,950 |
| 2018 | $8,560 | $198,250 | $27,300 | $170,950 |
| 2017 | $3,883 | $19,100 | $19,100 | $0 |
| 2016 | $3,843 | $19,100 | $19,100 | $0 |
| 2015 | $2,636 | $13,000 | $13,000 | $0 |
| 2014 | $867 | $150 | $150 | $0 |
Source: Public Records
Map
Nearby Homes
- 4835 39th St S
- 3924 49th Ave S
- 4795 39th St S
- 4928 Avery Ln S
- 4703 Woodhaven St S
- 6669 Belding Dr S
- 4012 53rd Ave S
- 4120 53rd Ave S
- 4775 44th St S
- 5135 44th St S
- 4390 46th Ave S Unit D
- 4154 Arthur Dr
- 5165 44th St S
- 4150 Arthur Dr
- 4150 Arthur Dr
- 3564 47th Ave S
- 6750 55th Ave S
- 4267 Ponderosa Place S
- 4170 Arthur Dr
- 4794 41st St S
- 4834 41st St S
- 4831 40th St S
- 4811 40th St S
- 4858 41st St S
- 4853 40th St S
- 4793 40th St S
- 4815 41st St S
- 4791 41st St S
- 4829 41st St S
- 4758 41st St S
- 4779 41st St S
- 4841 41st St S
- 4773 40th St S
- 4063 49th Ave S
- 4041 49th Ave S
- 4085 49th Ave S
- 4761 41st St S
- 4871 41st St S
- 4826 40th St S